Visualizing Social Media Use and its Influence on Online Shopping
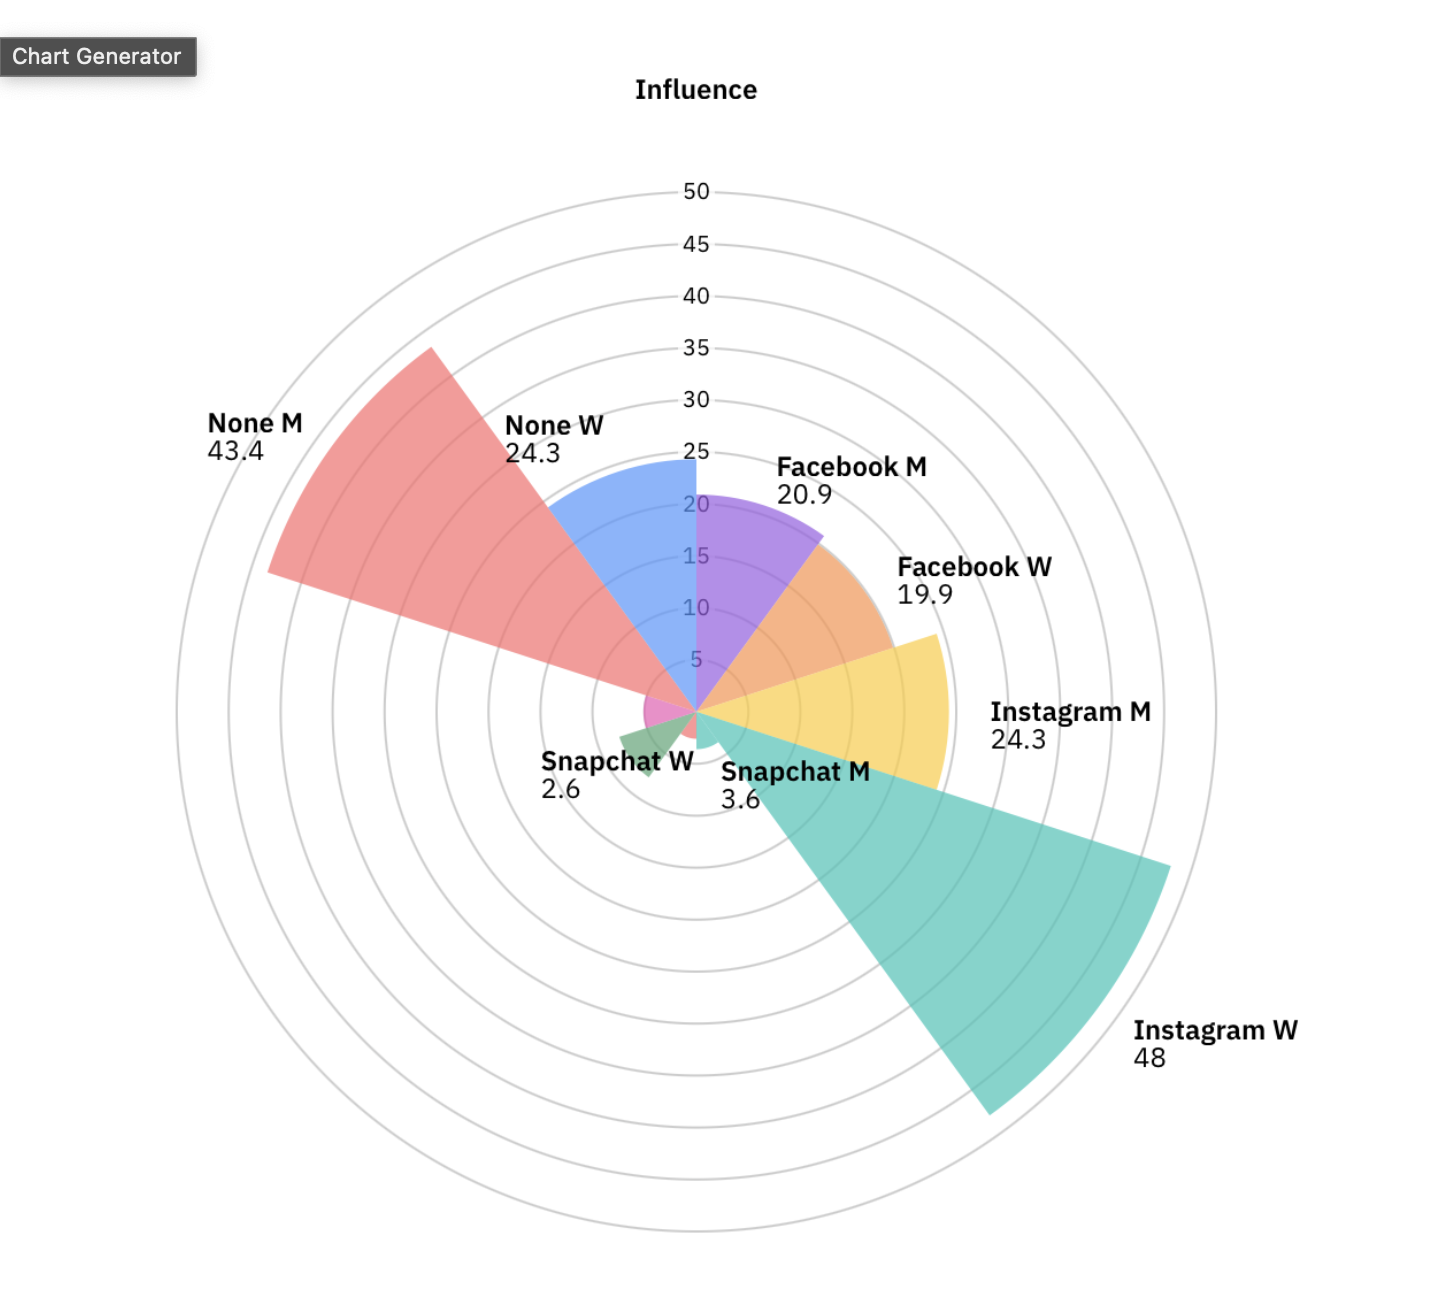
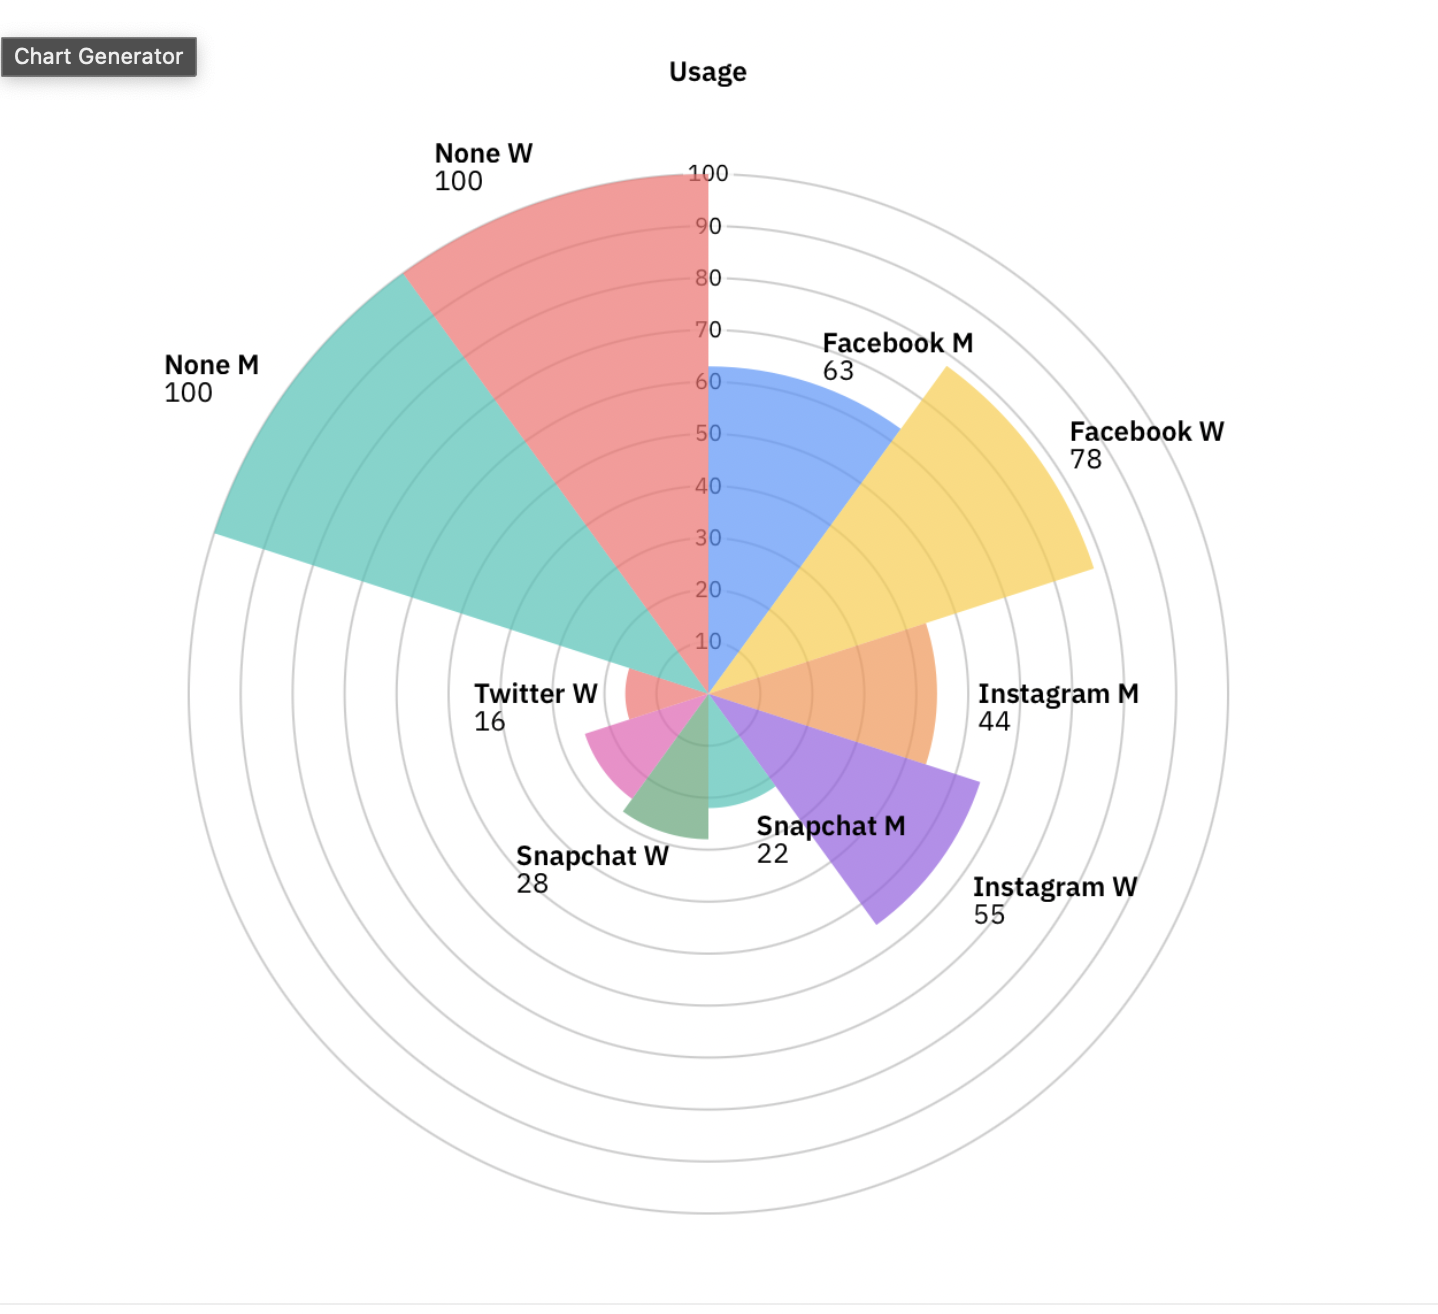
Using two data sets, I created a comparative visualization of social media usage and reported influence on online shopping by gender.
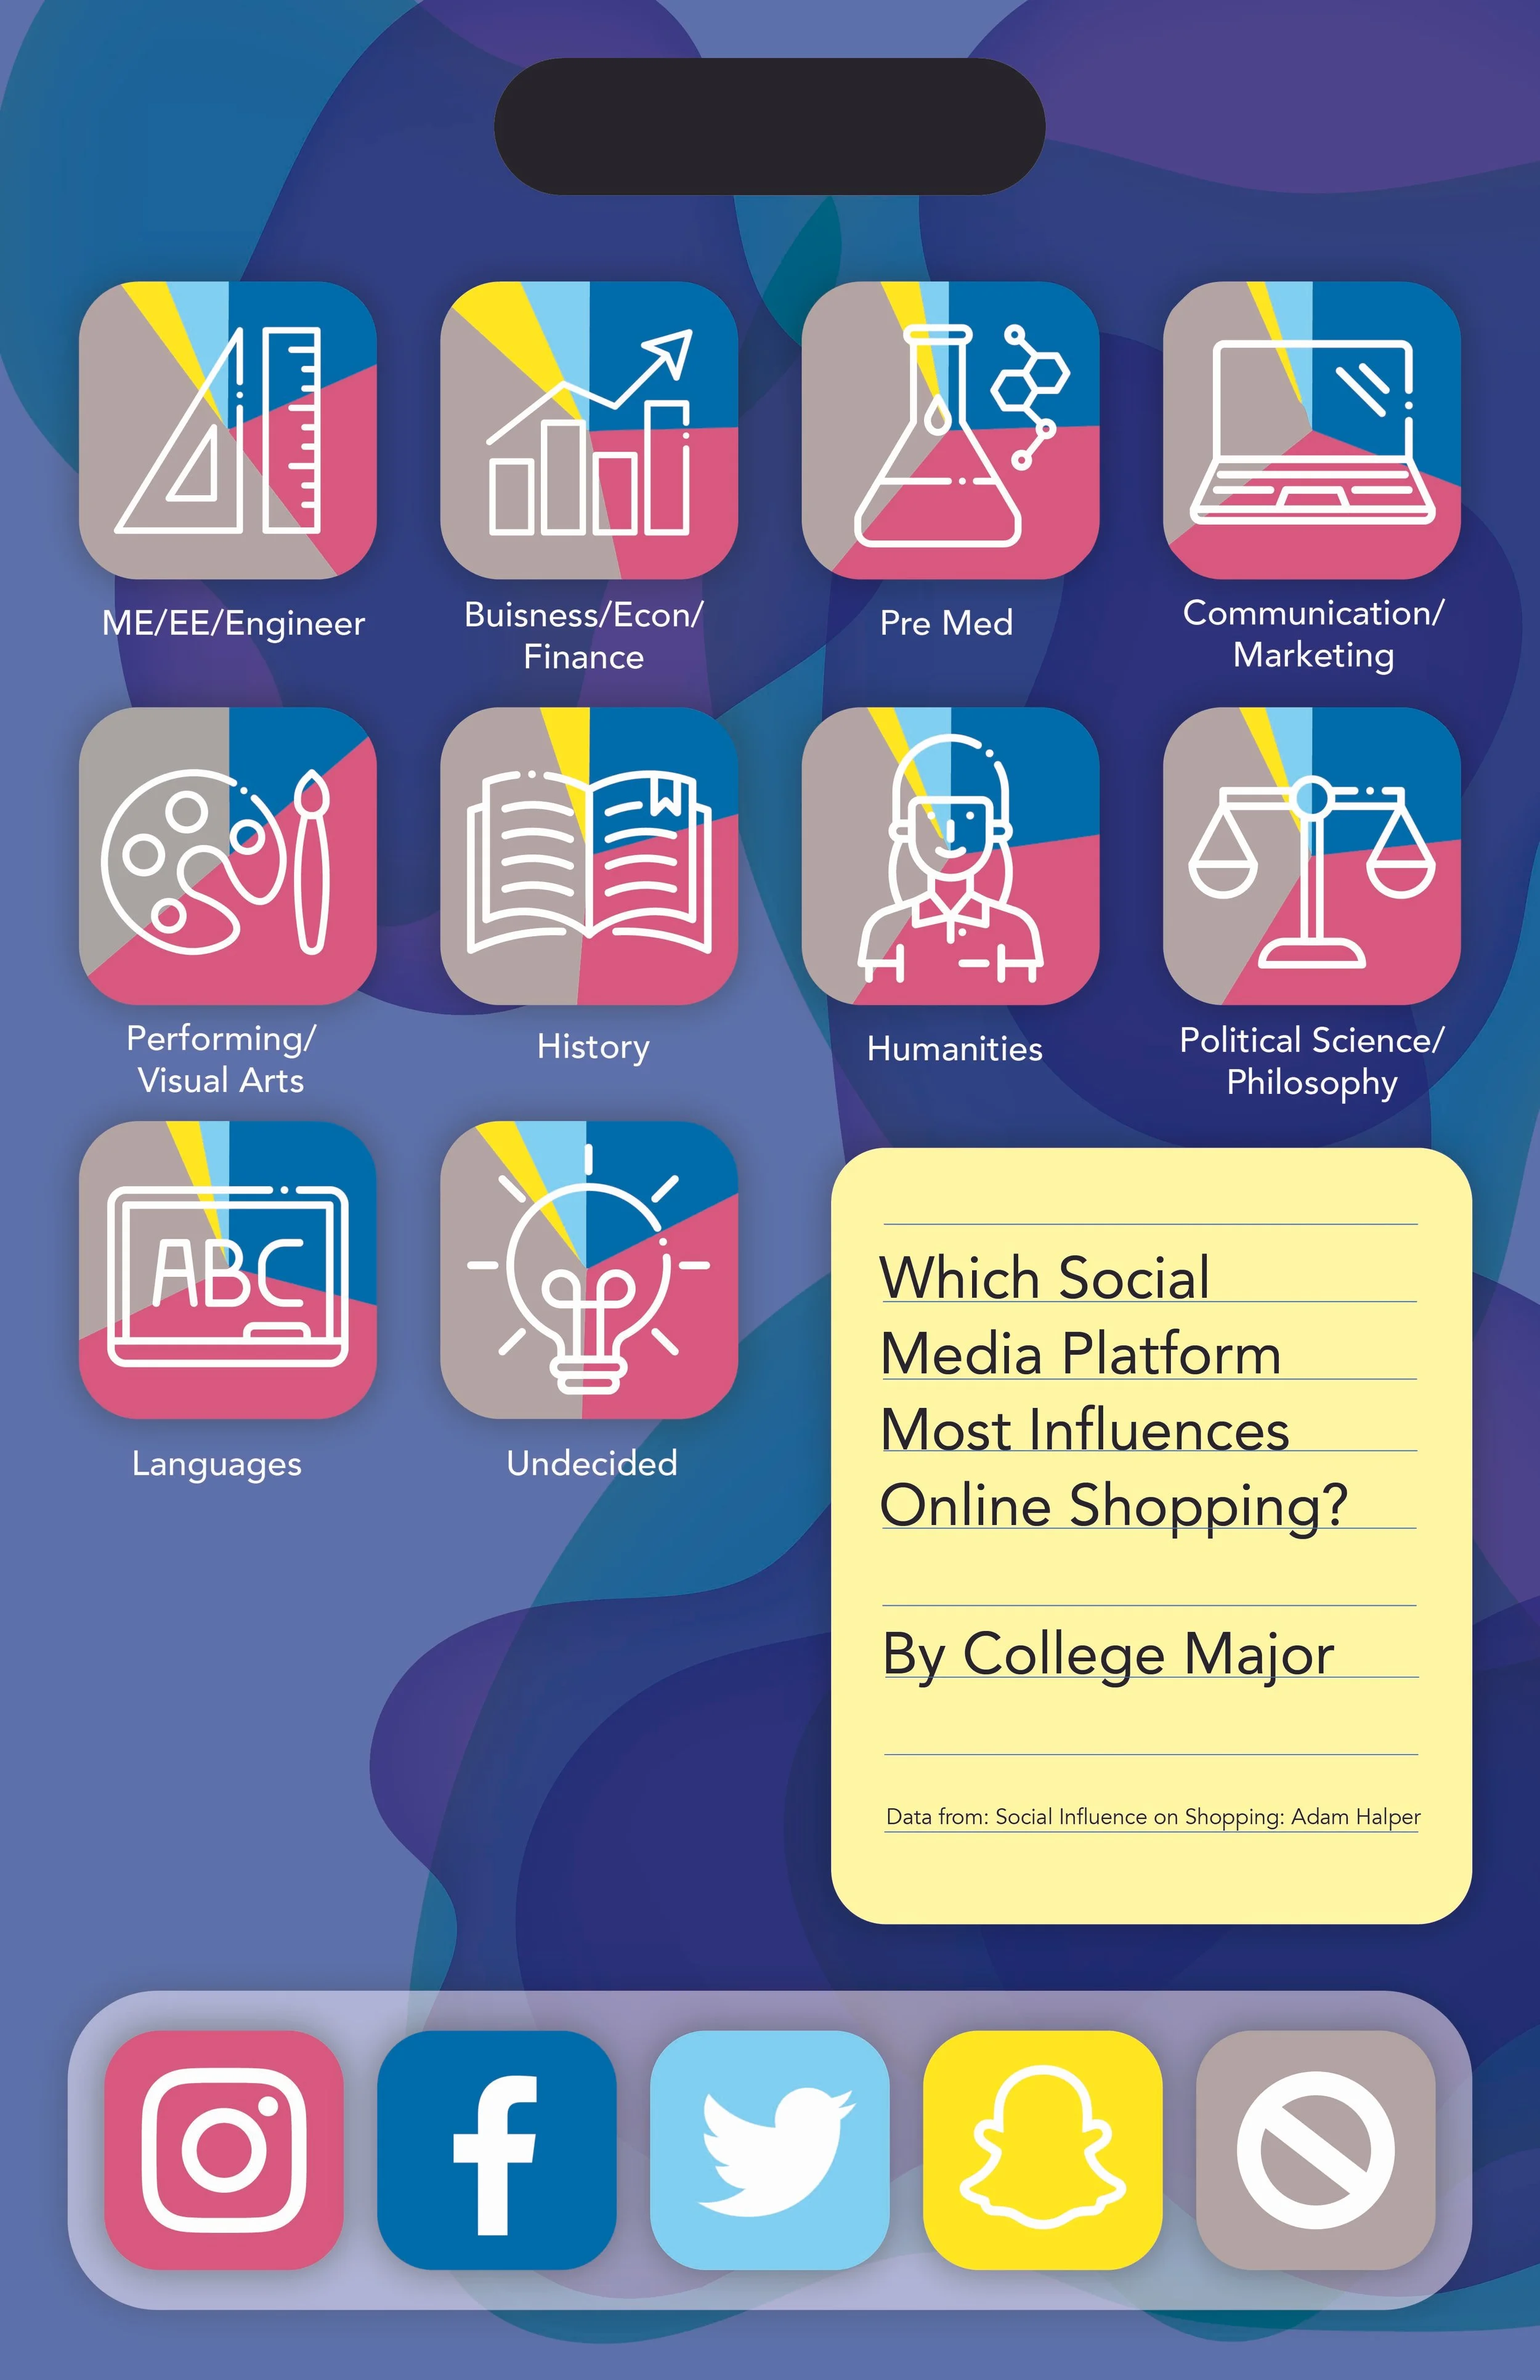
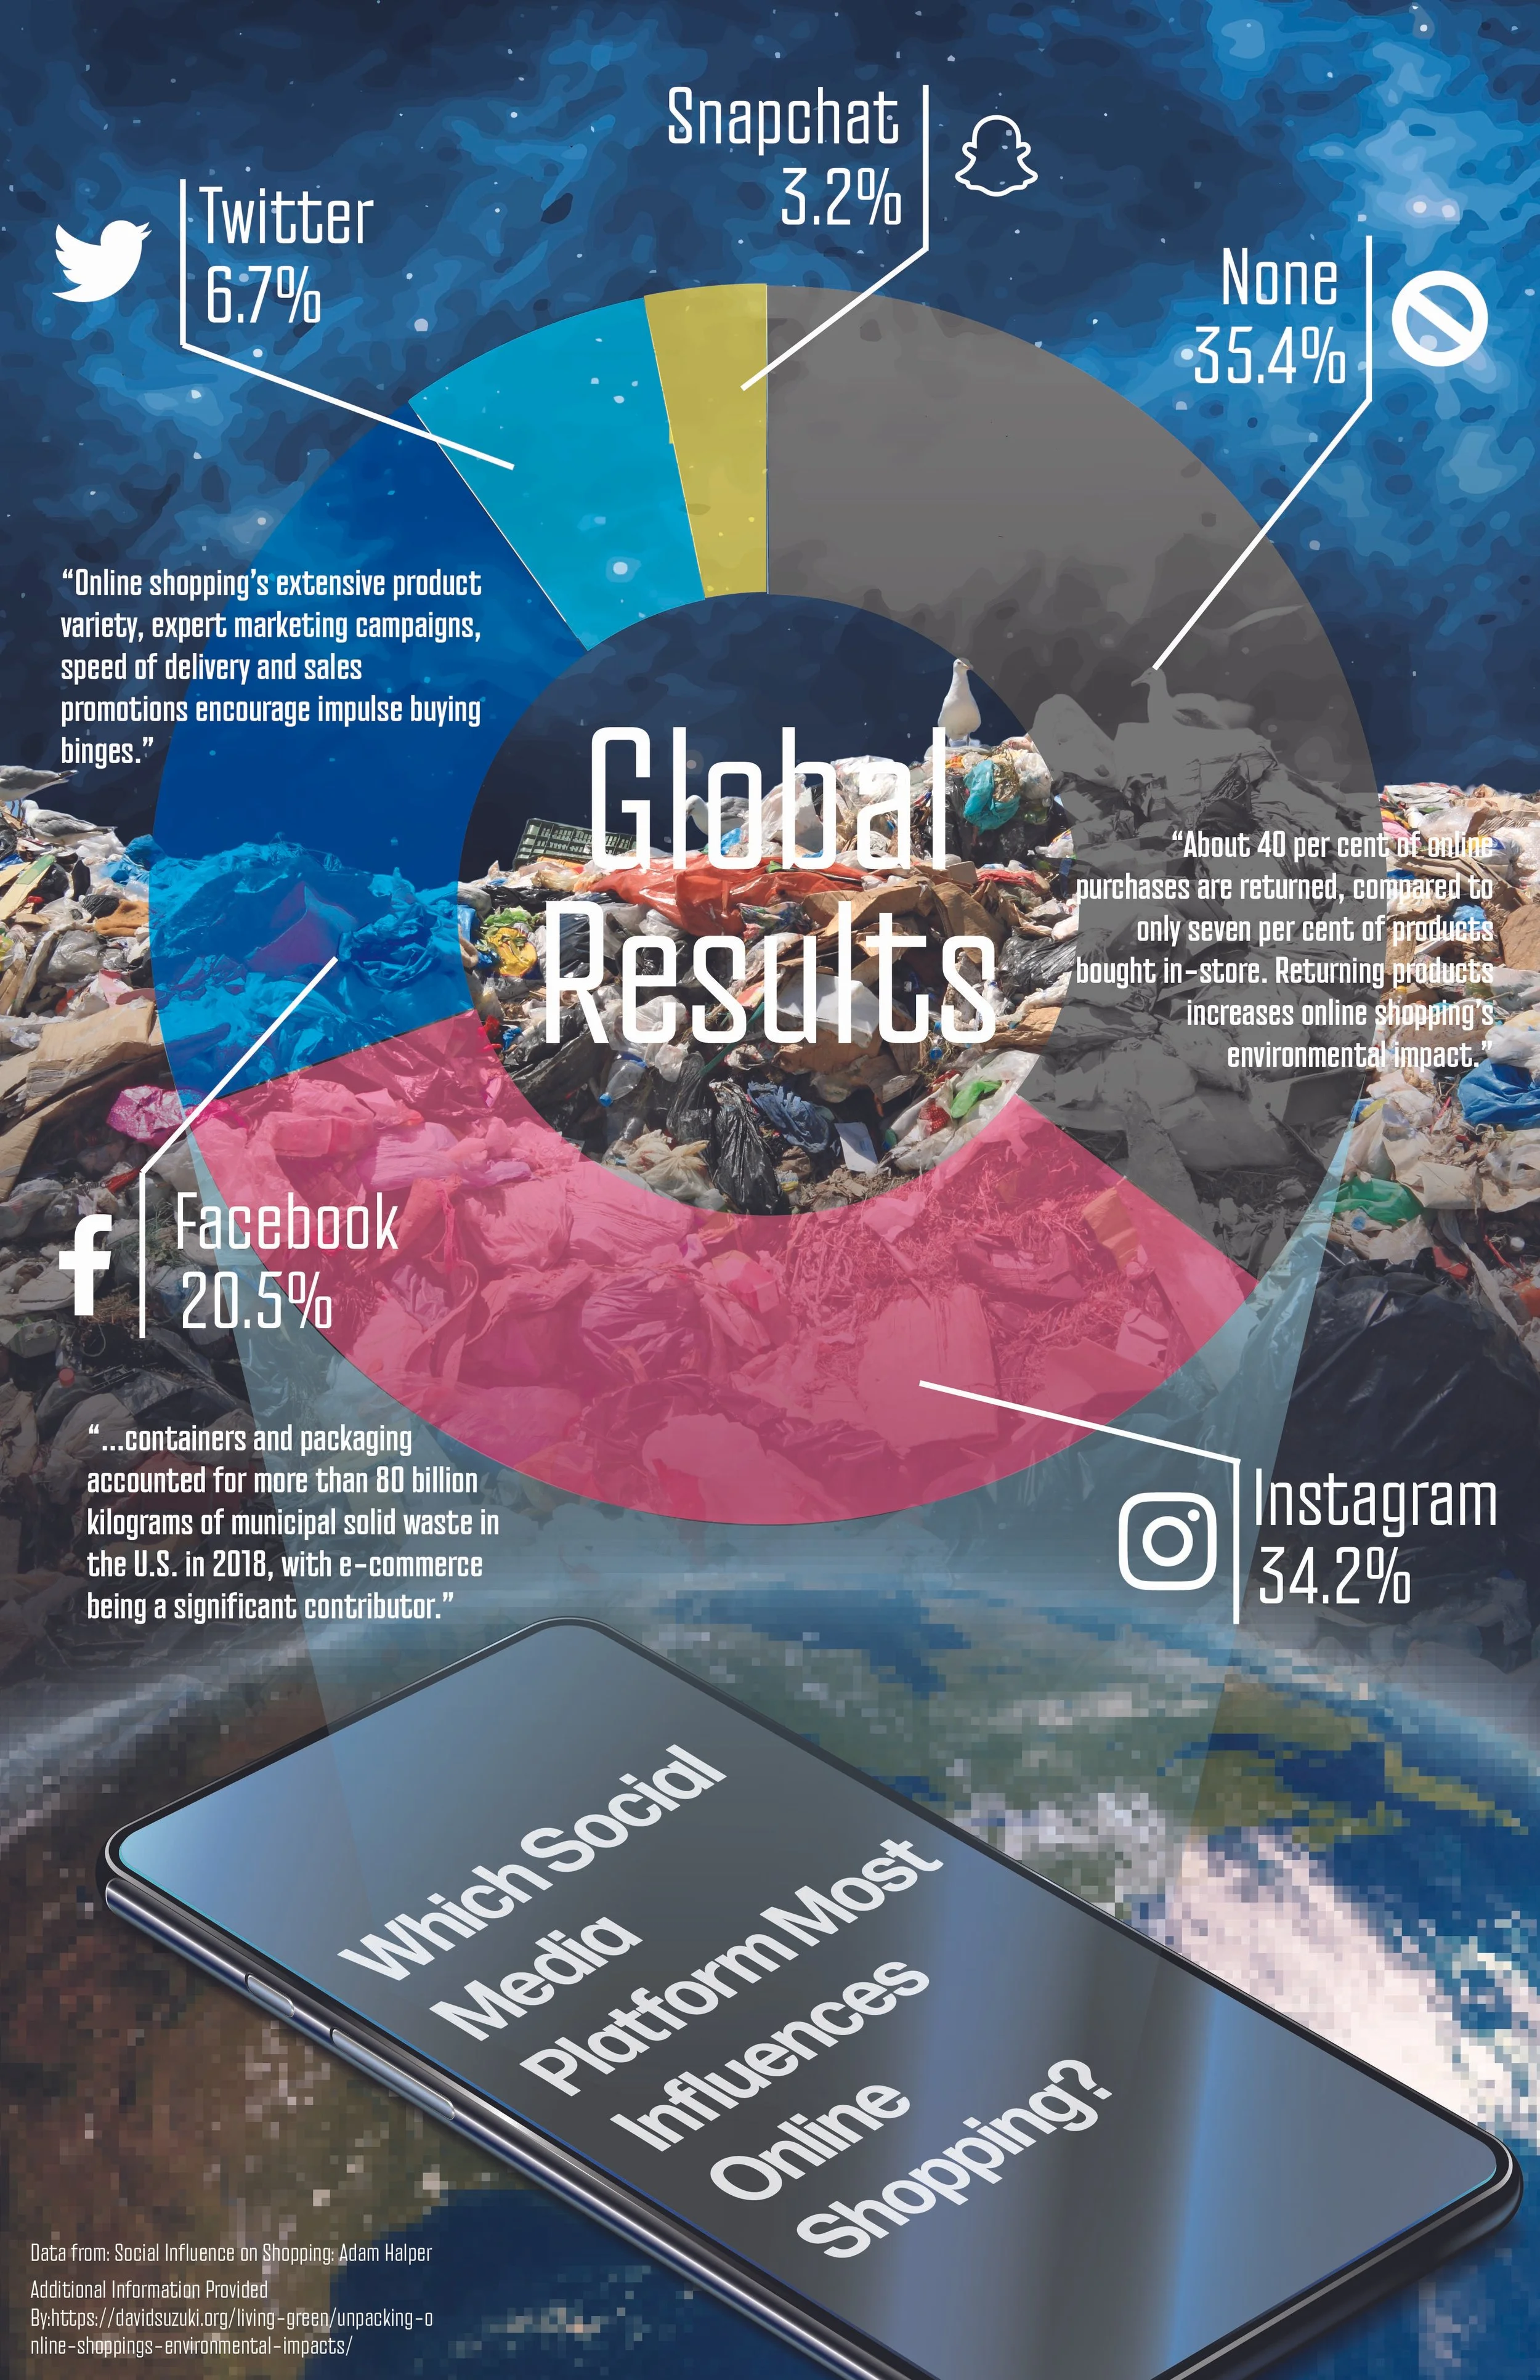
3 preliminary concepts
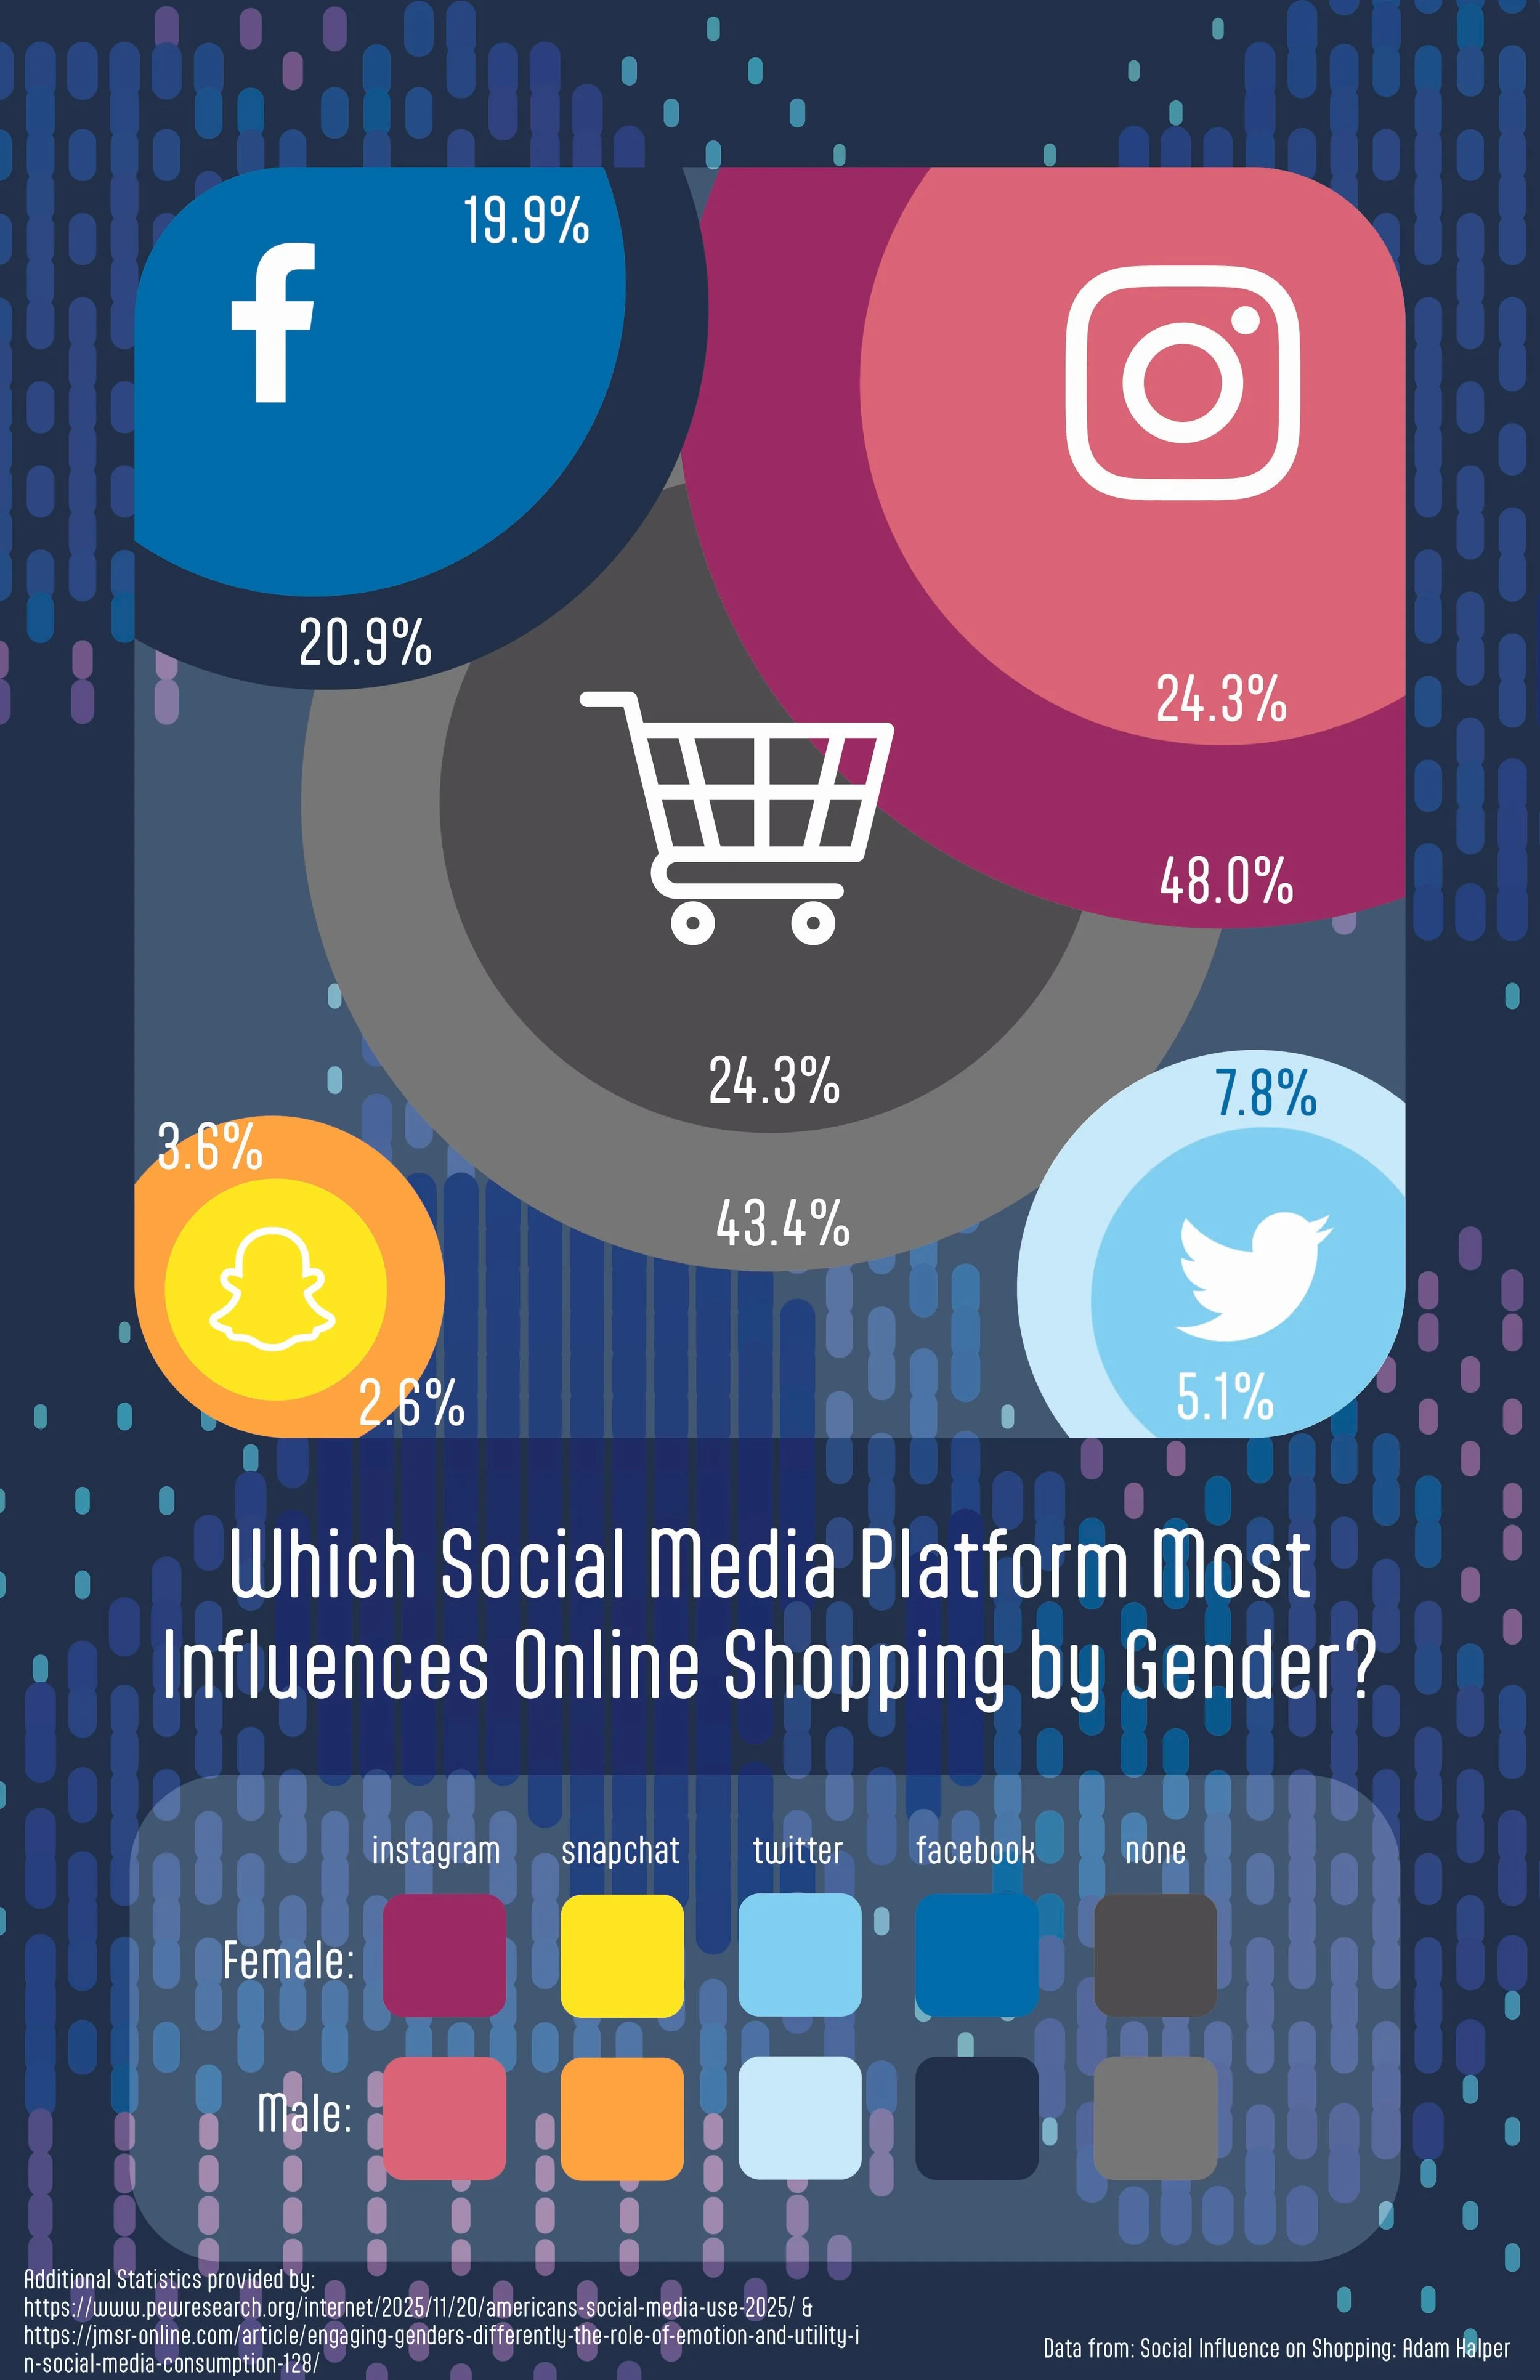
These three concepts only included my first data set, showcasing the reported influence a social media platform had on someone’s online shopping habits by gender, by college major, and the global results.
Visually, I wanted each concept to related back to technology and phones as that is focus of the data set.
Made at 11” x17”, these preliminary concepts allowed me to see the potential scale, color, and hierarchy of the poster when printed.
Data Visualization
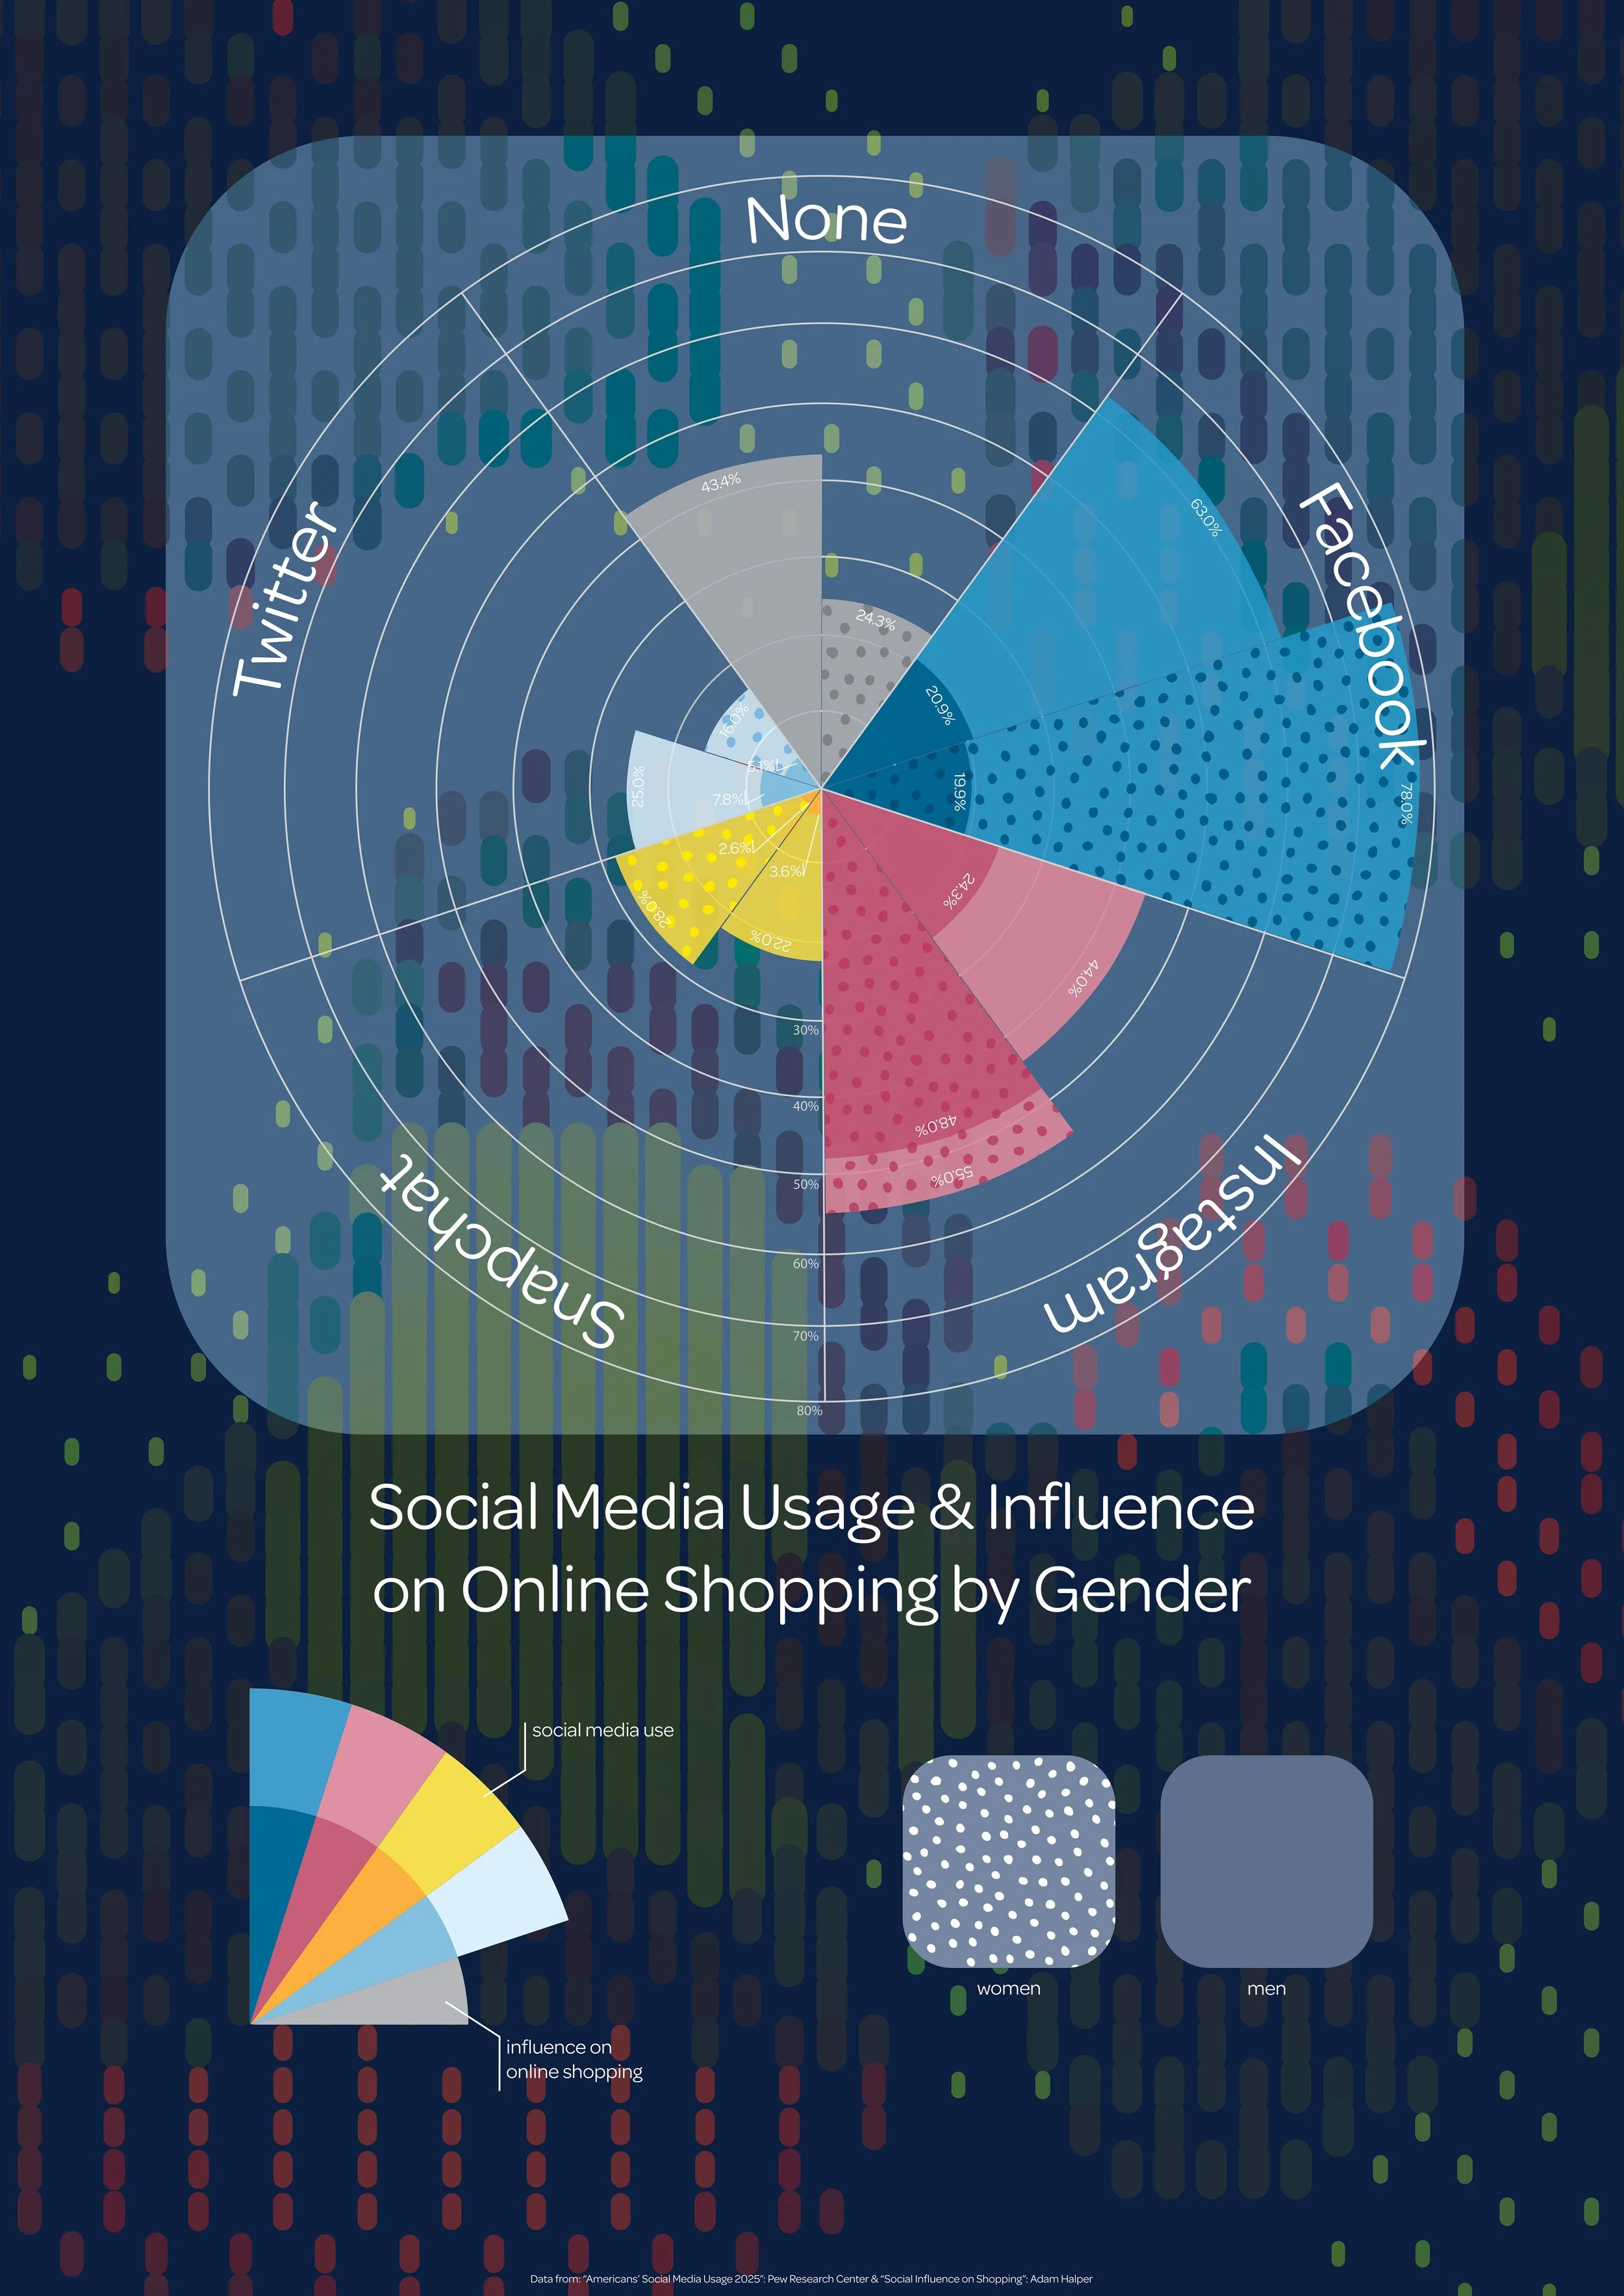
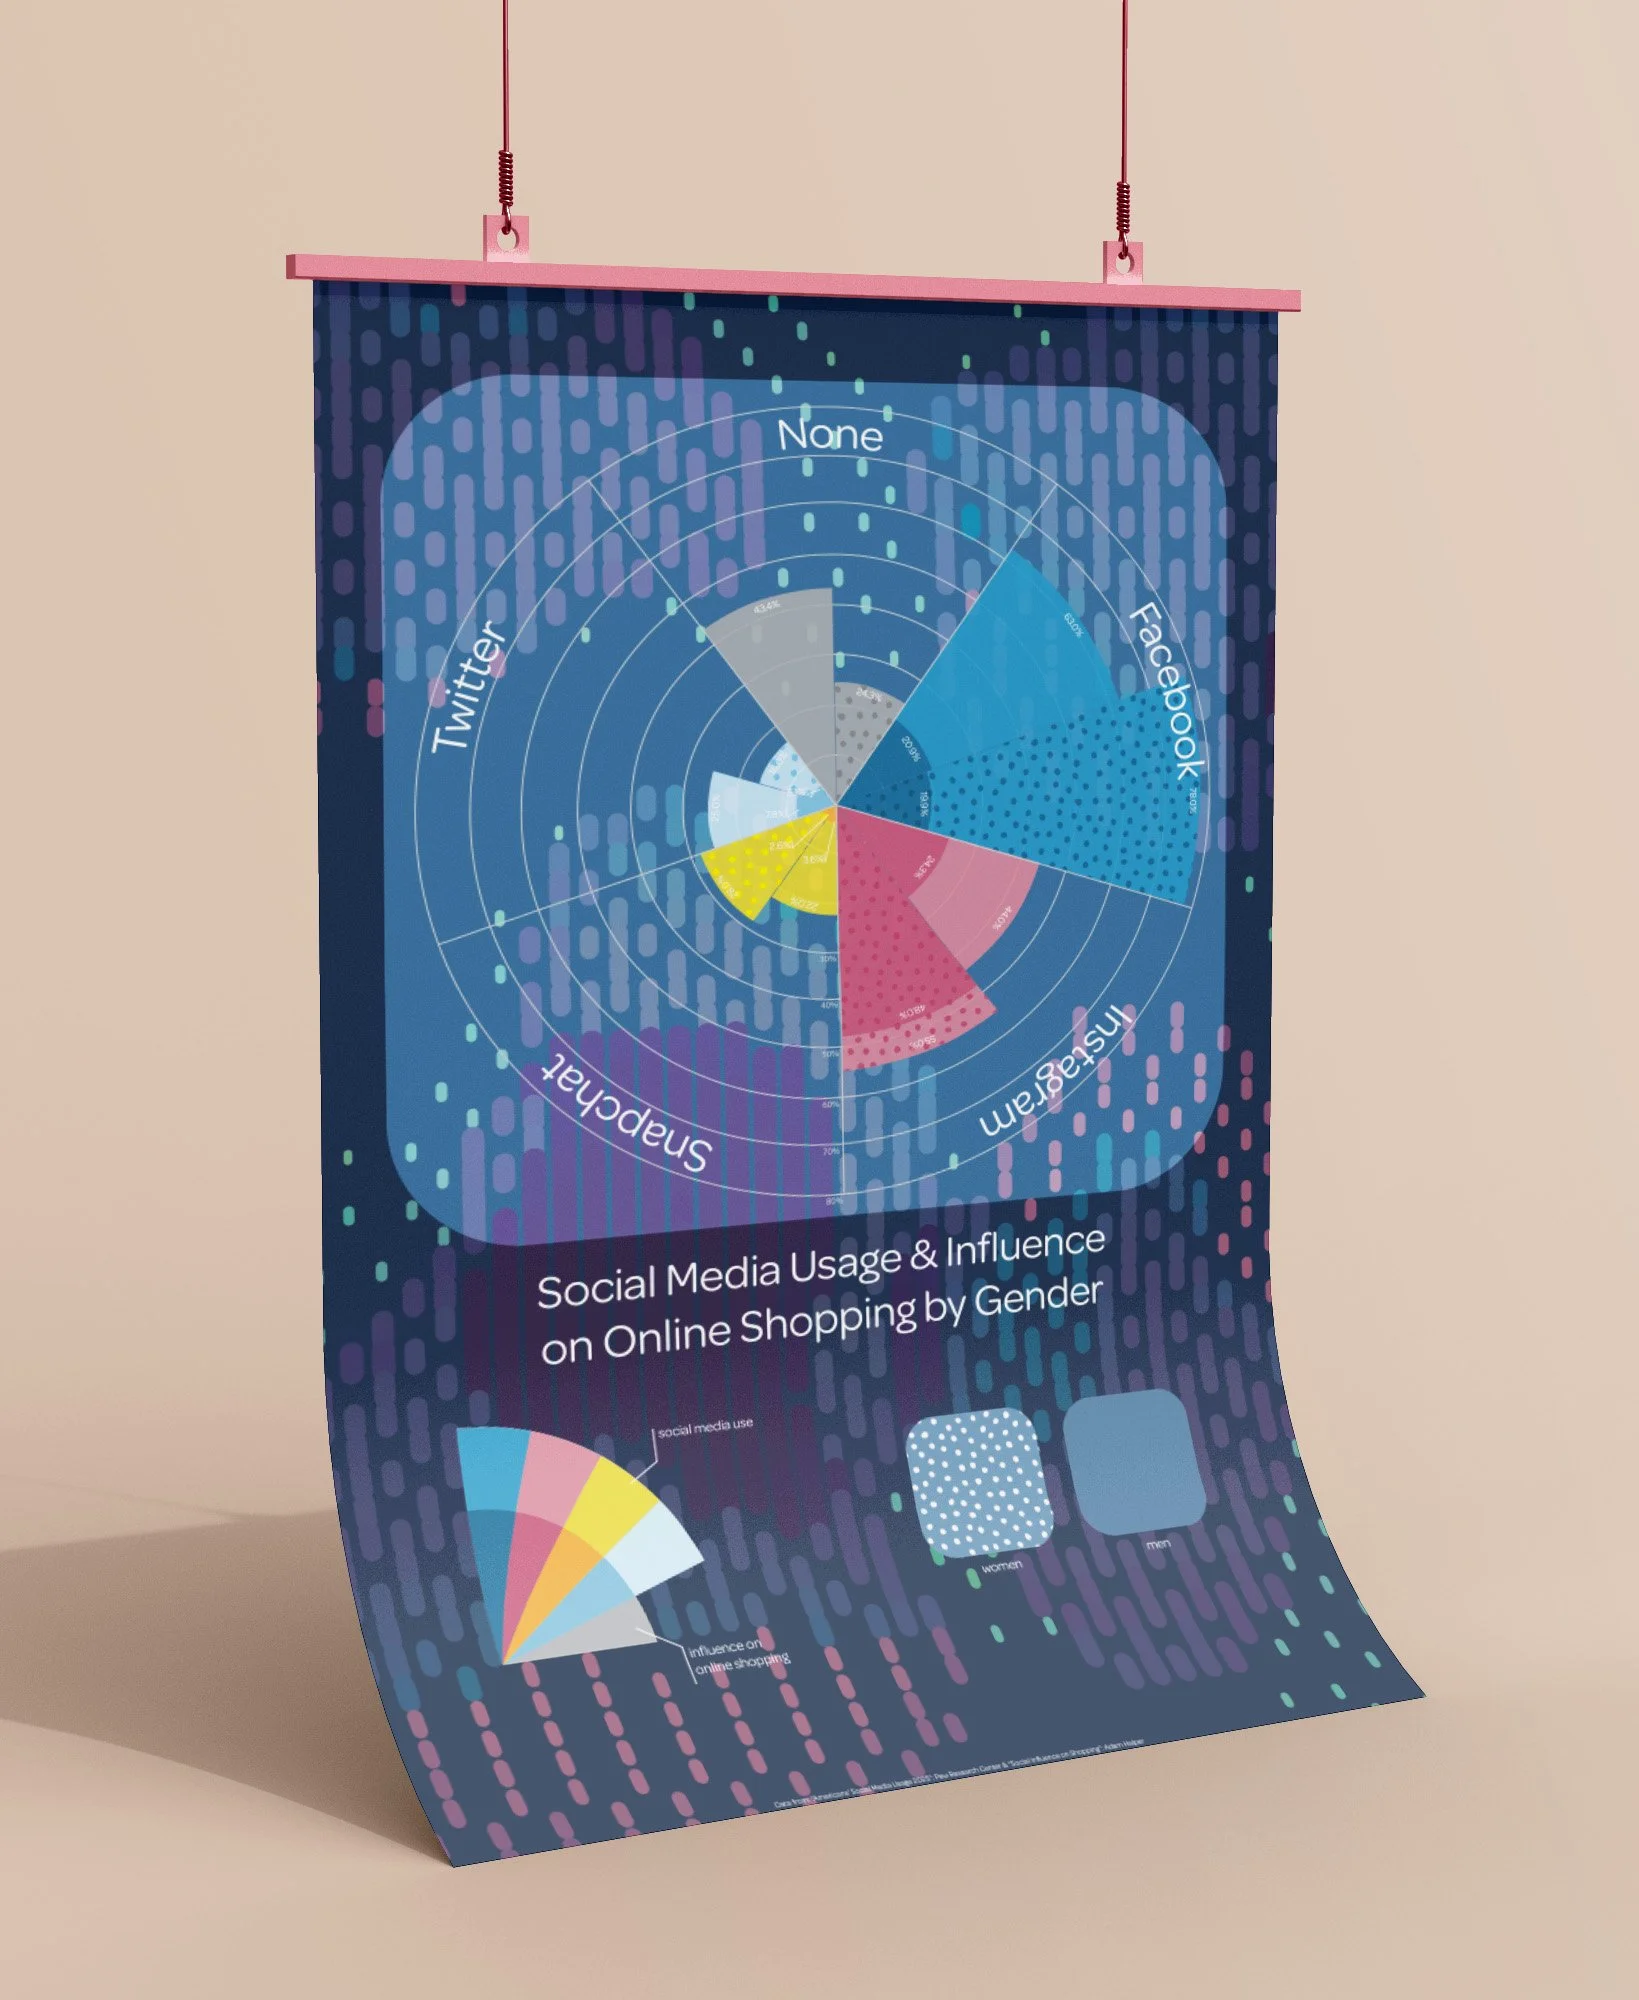
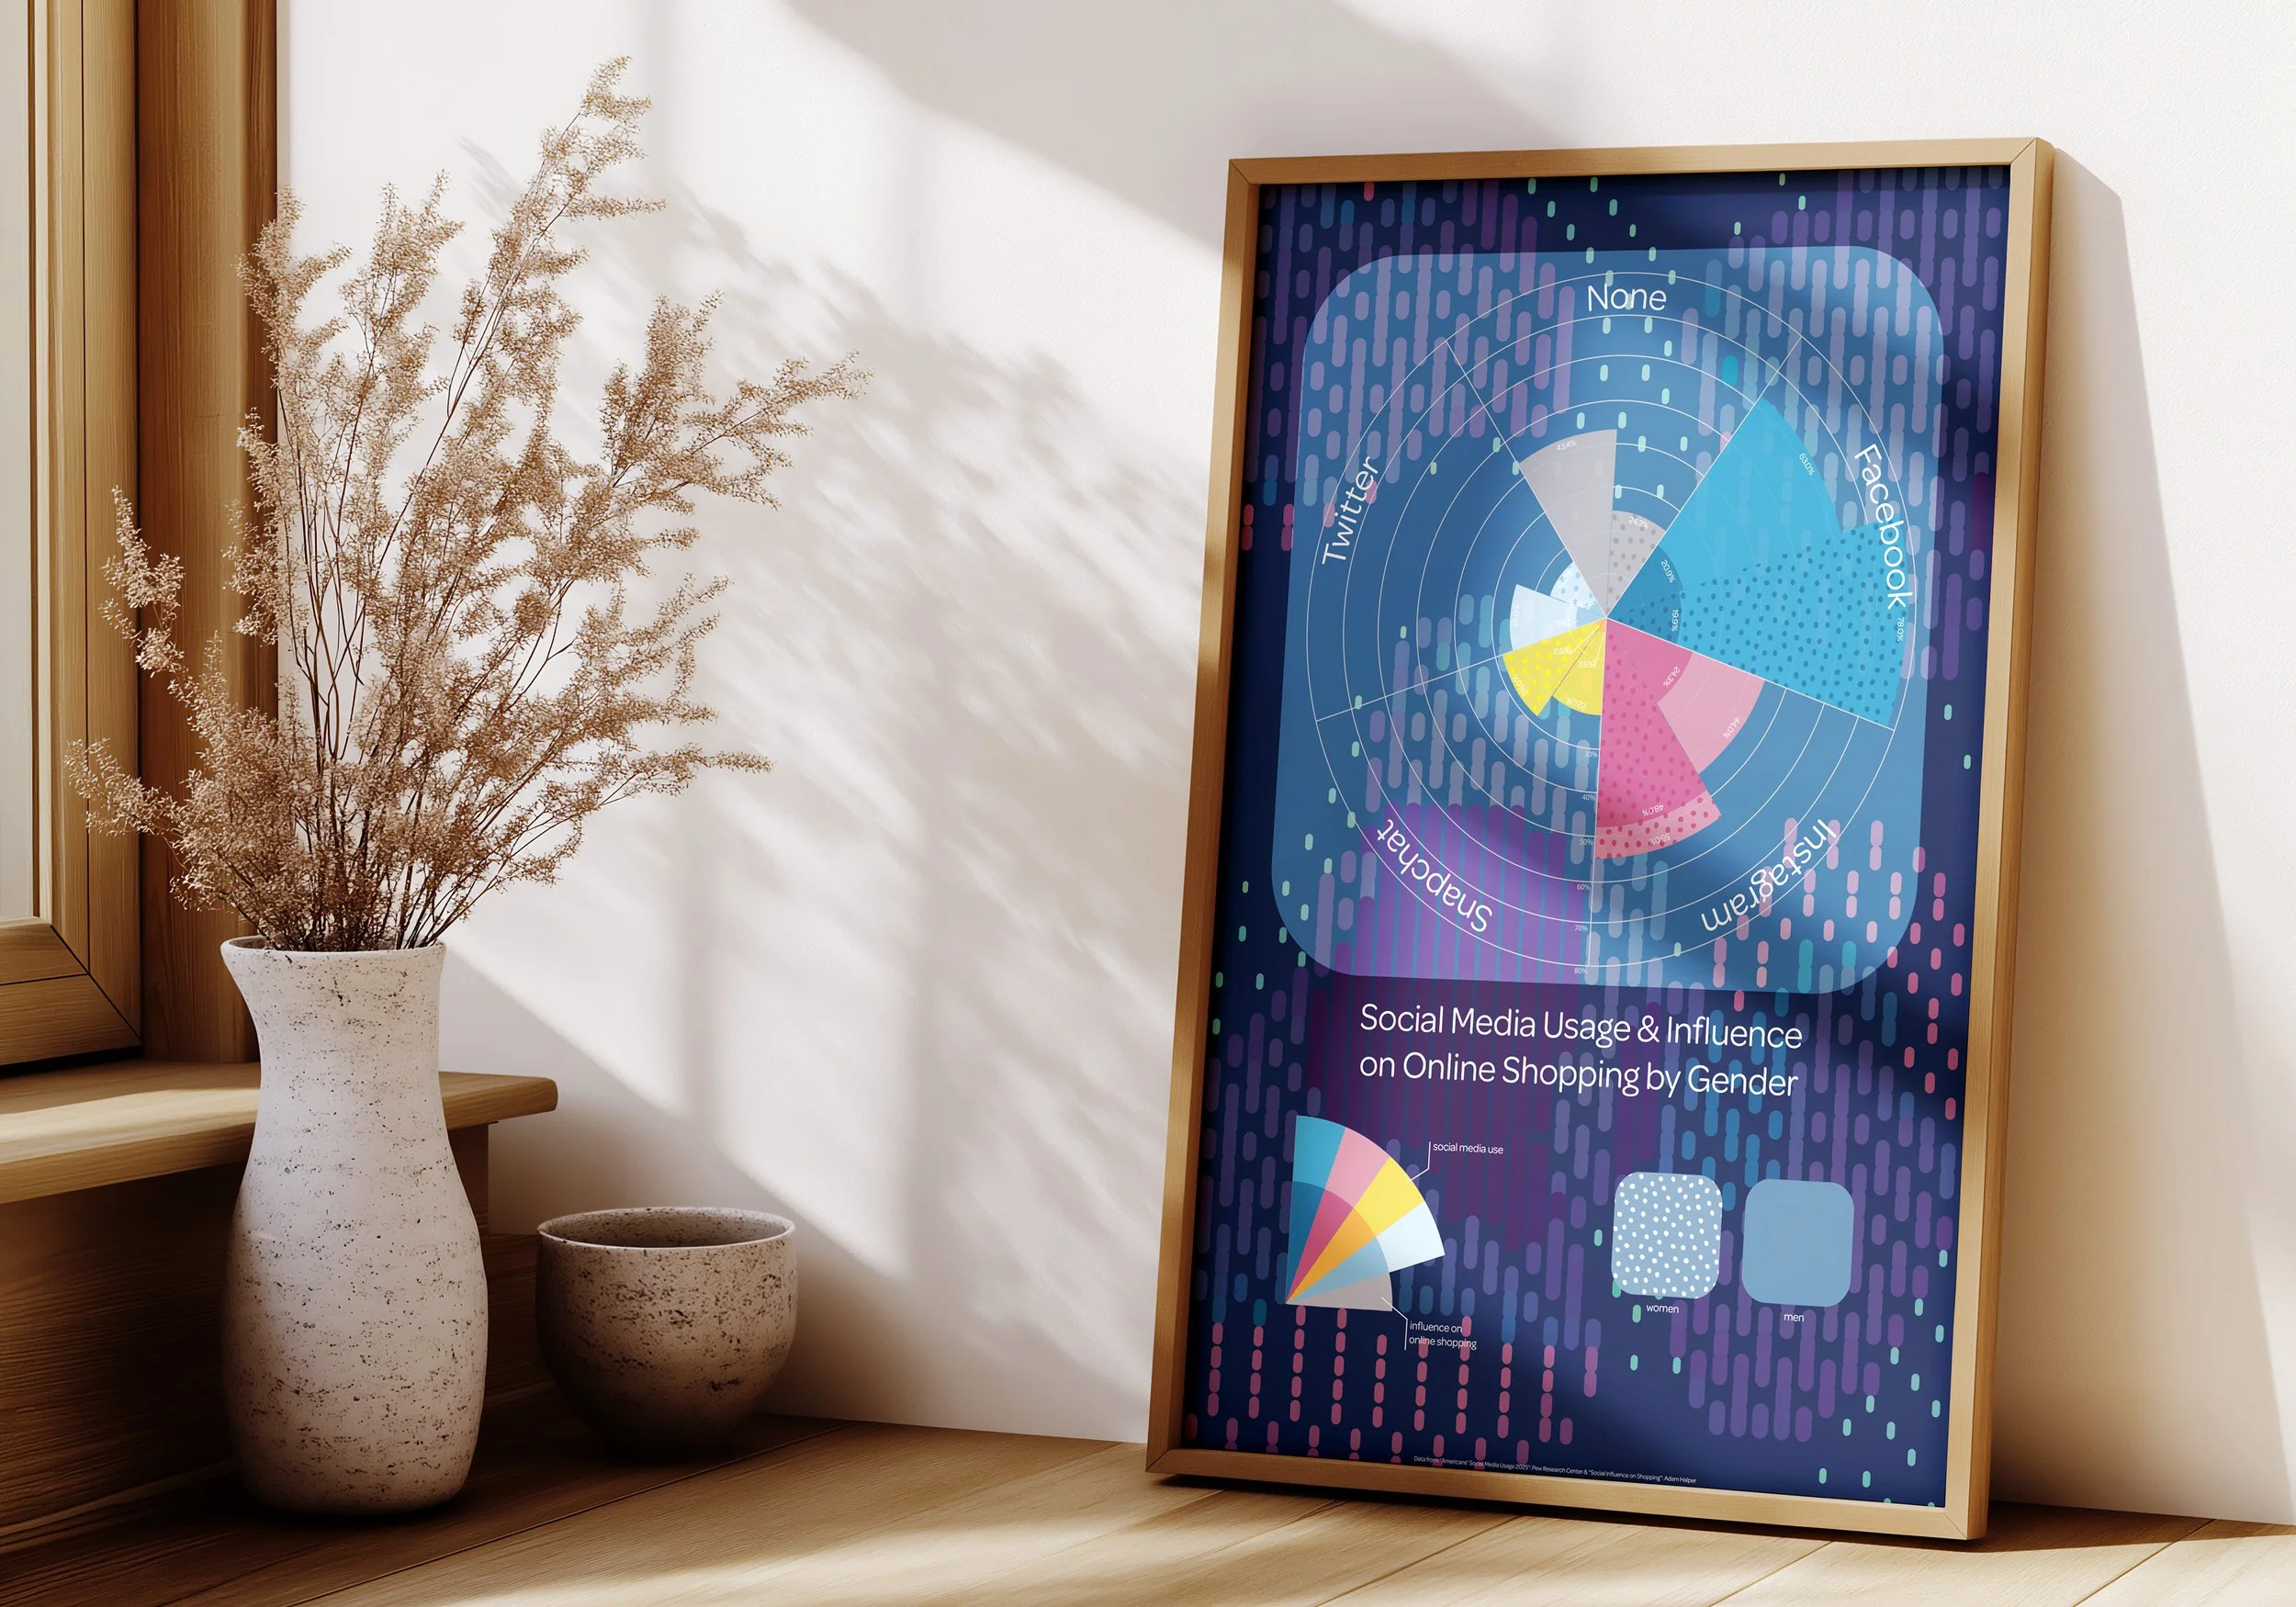
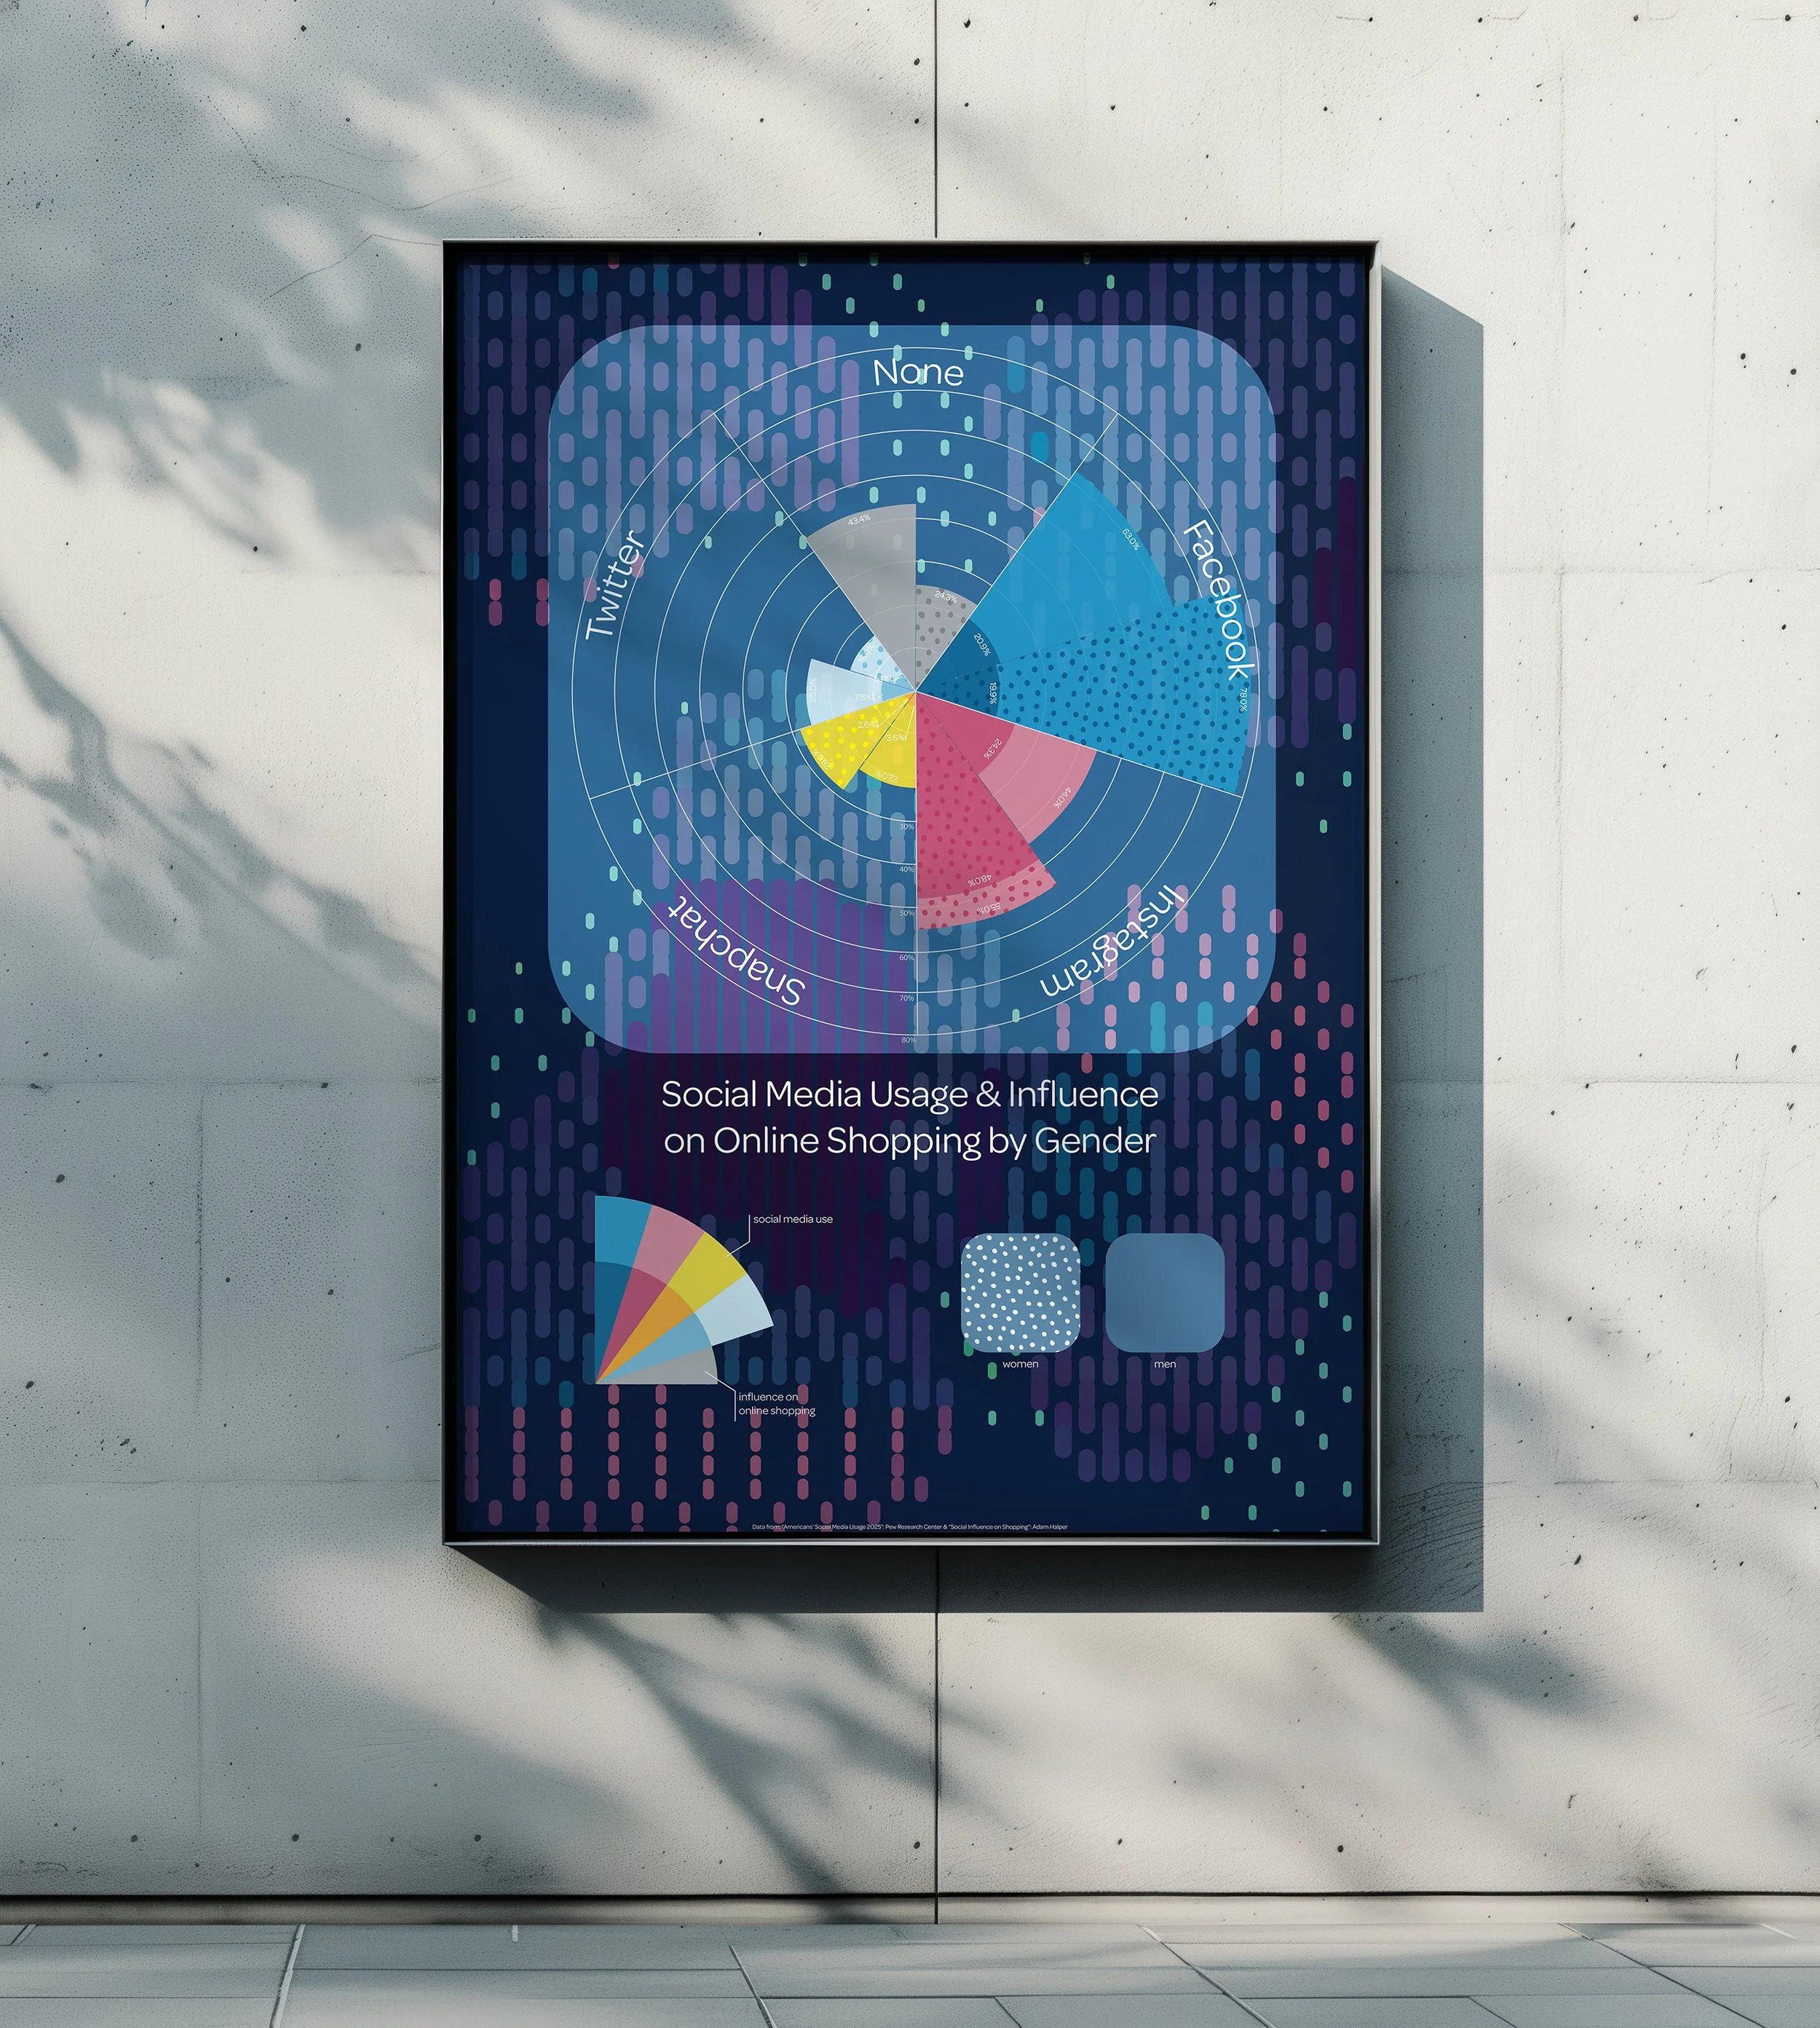
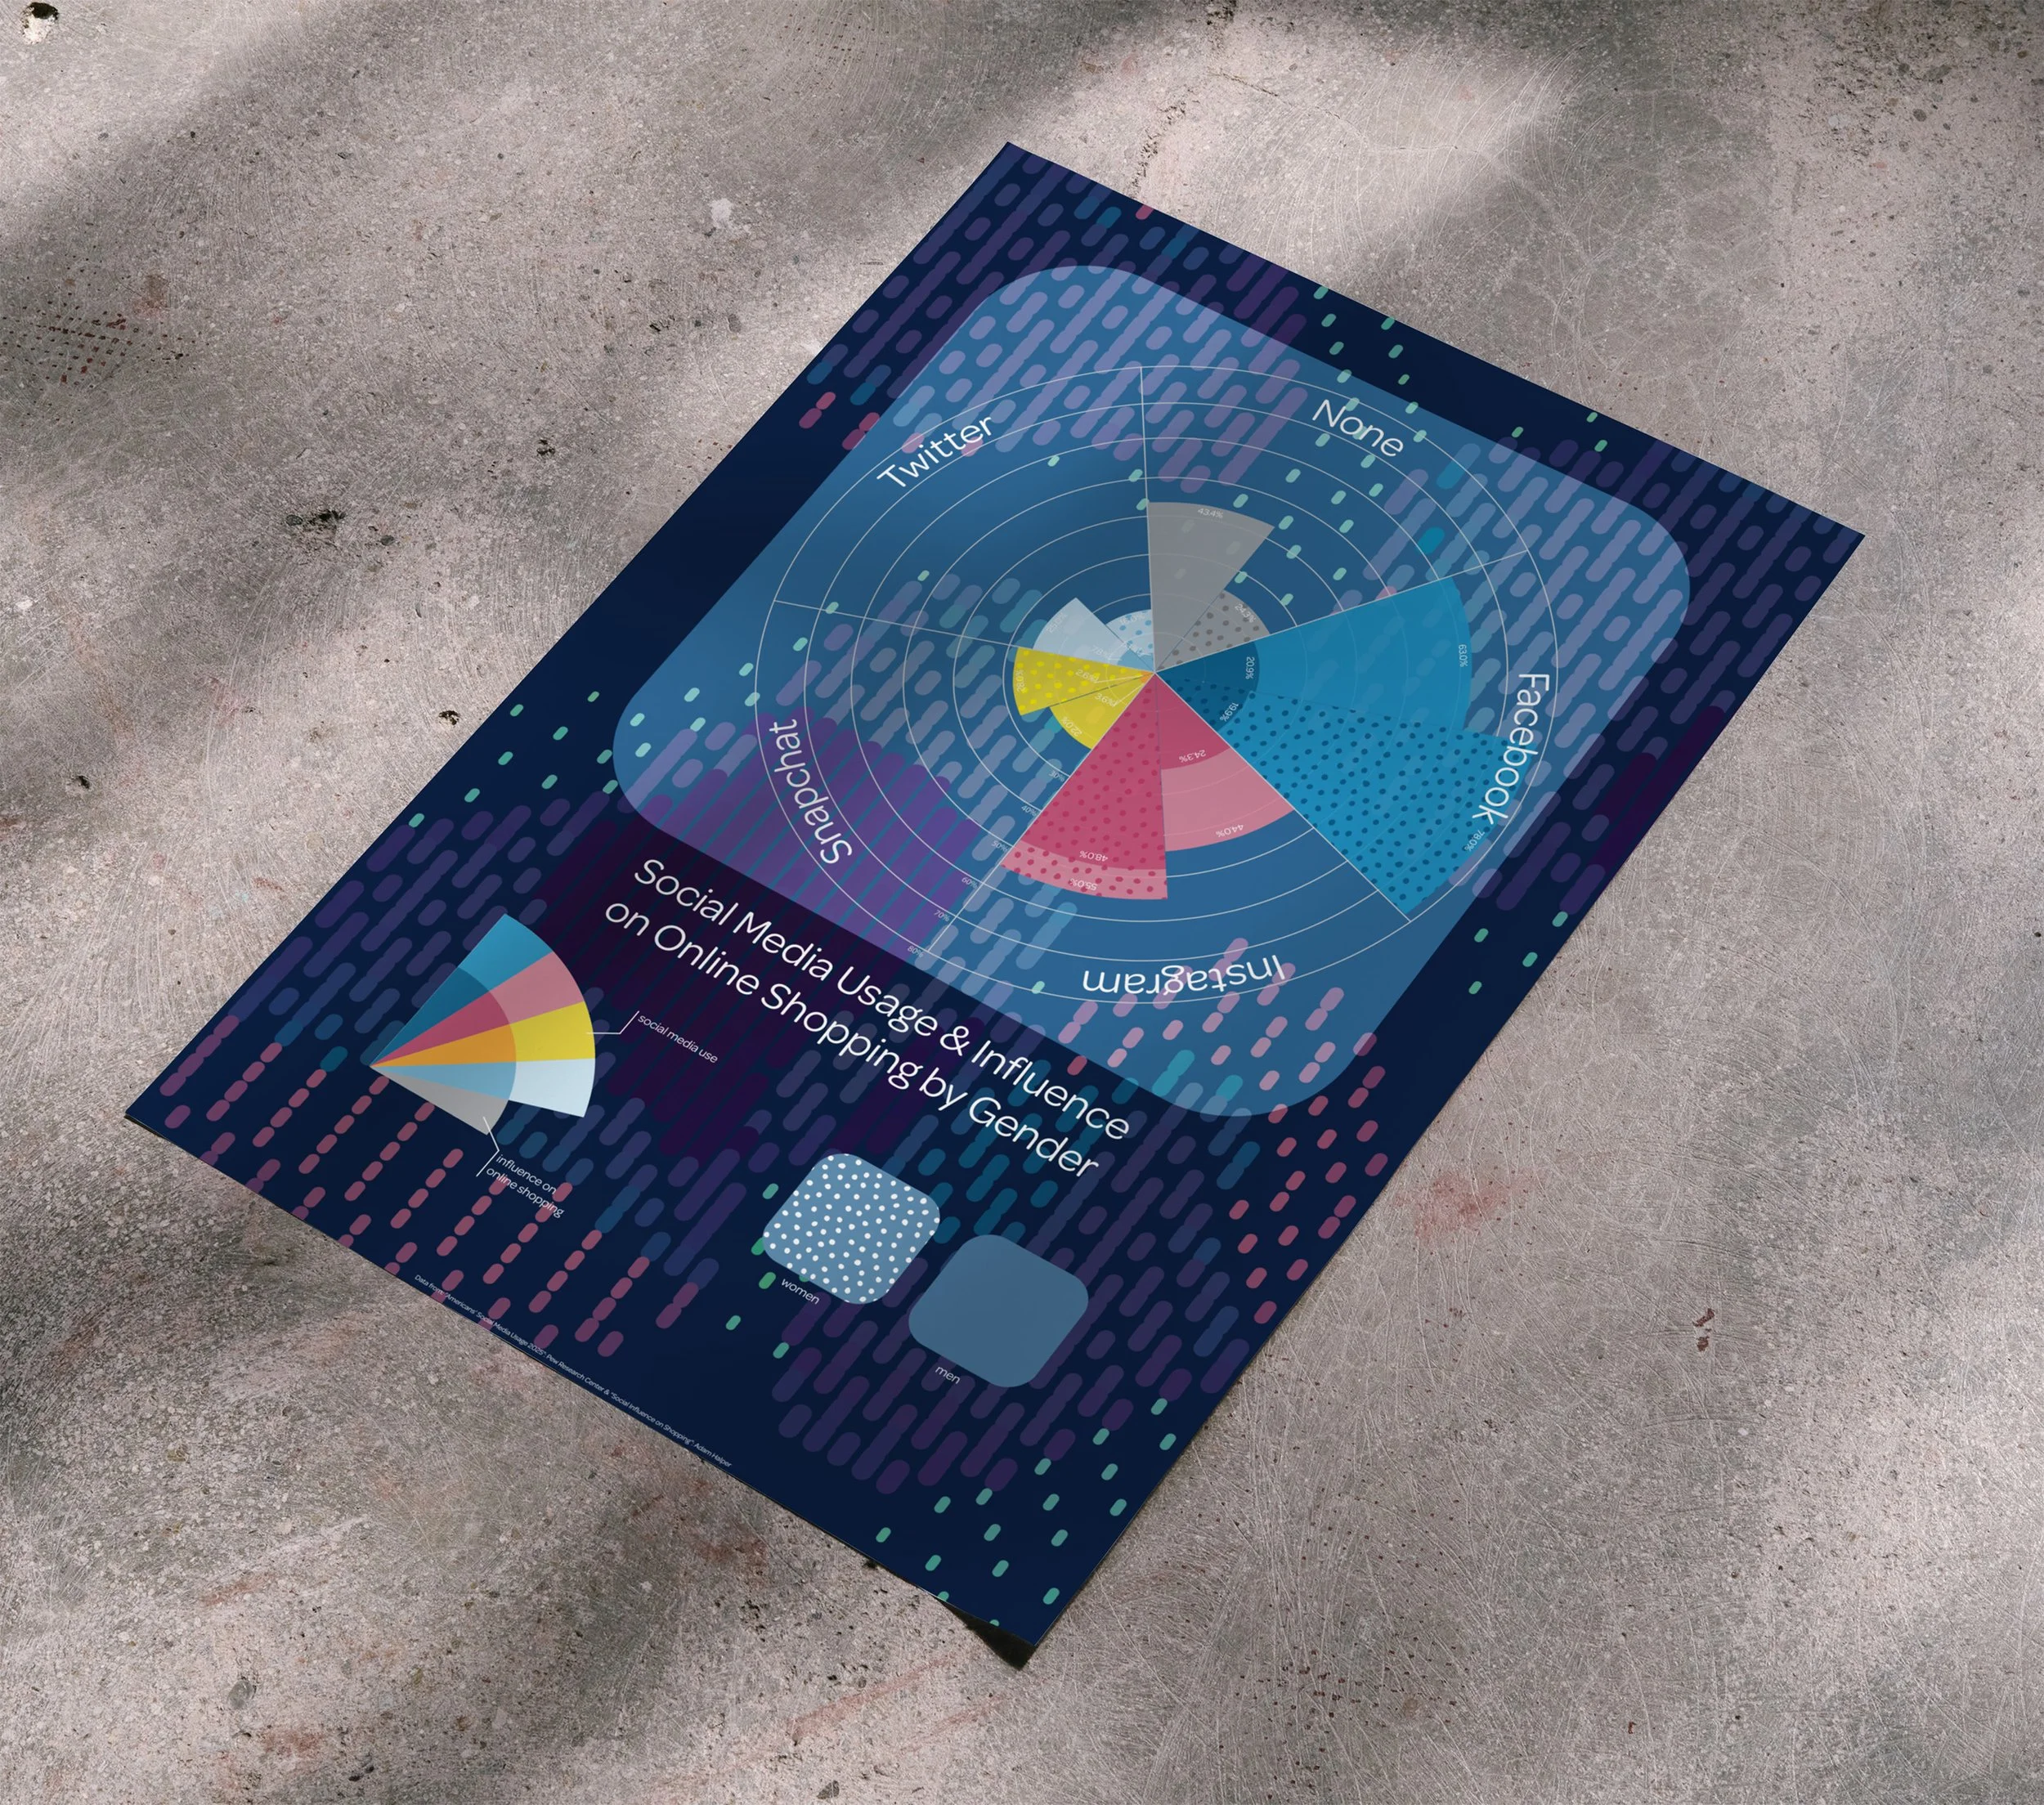
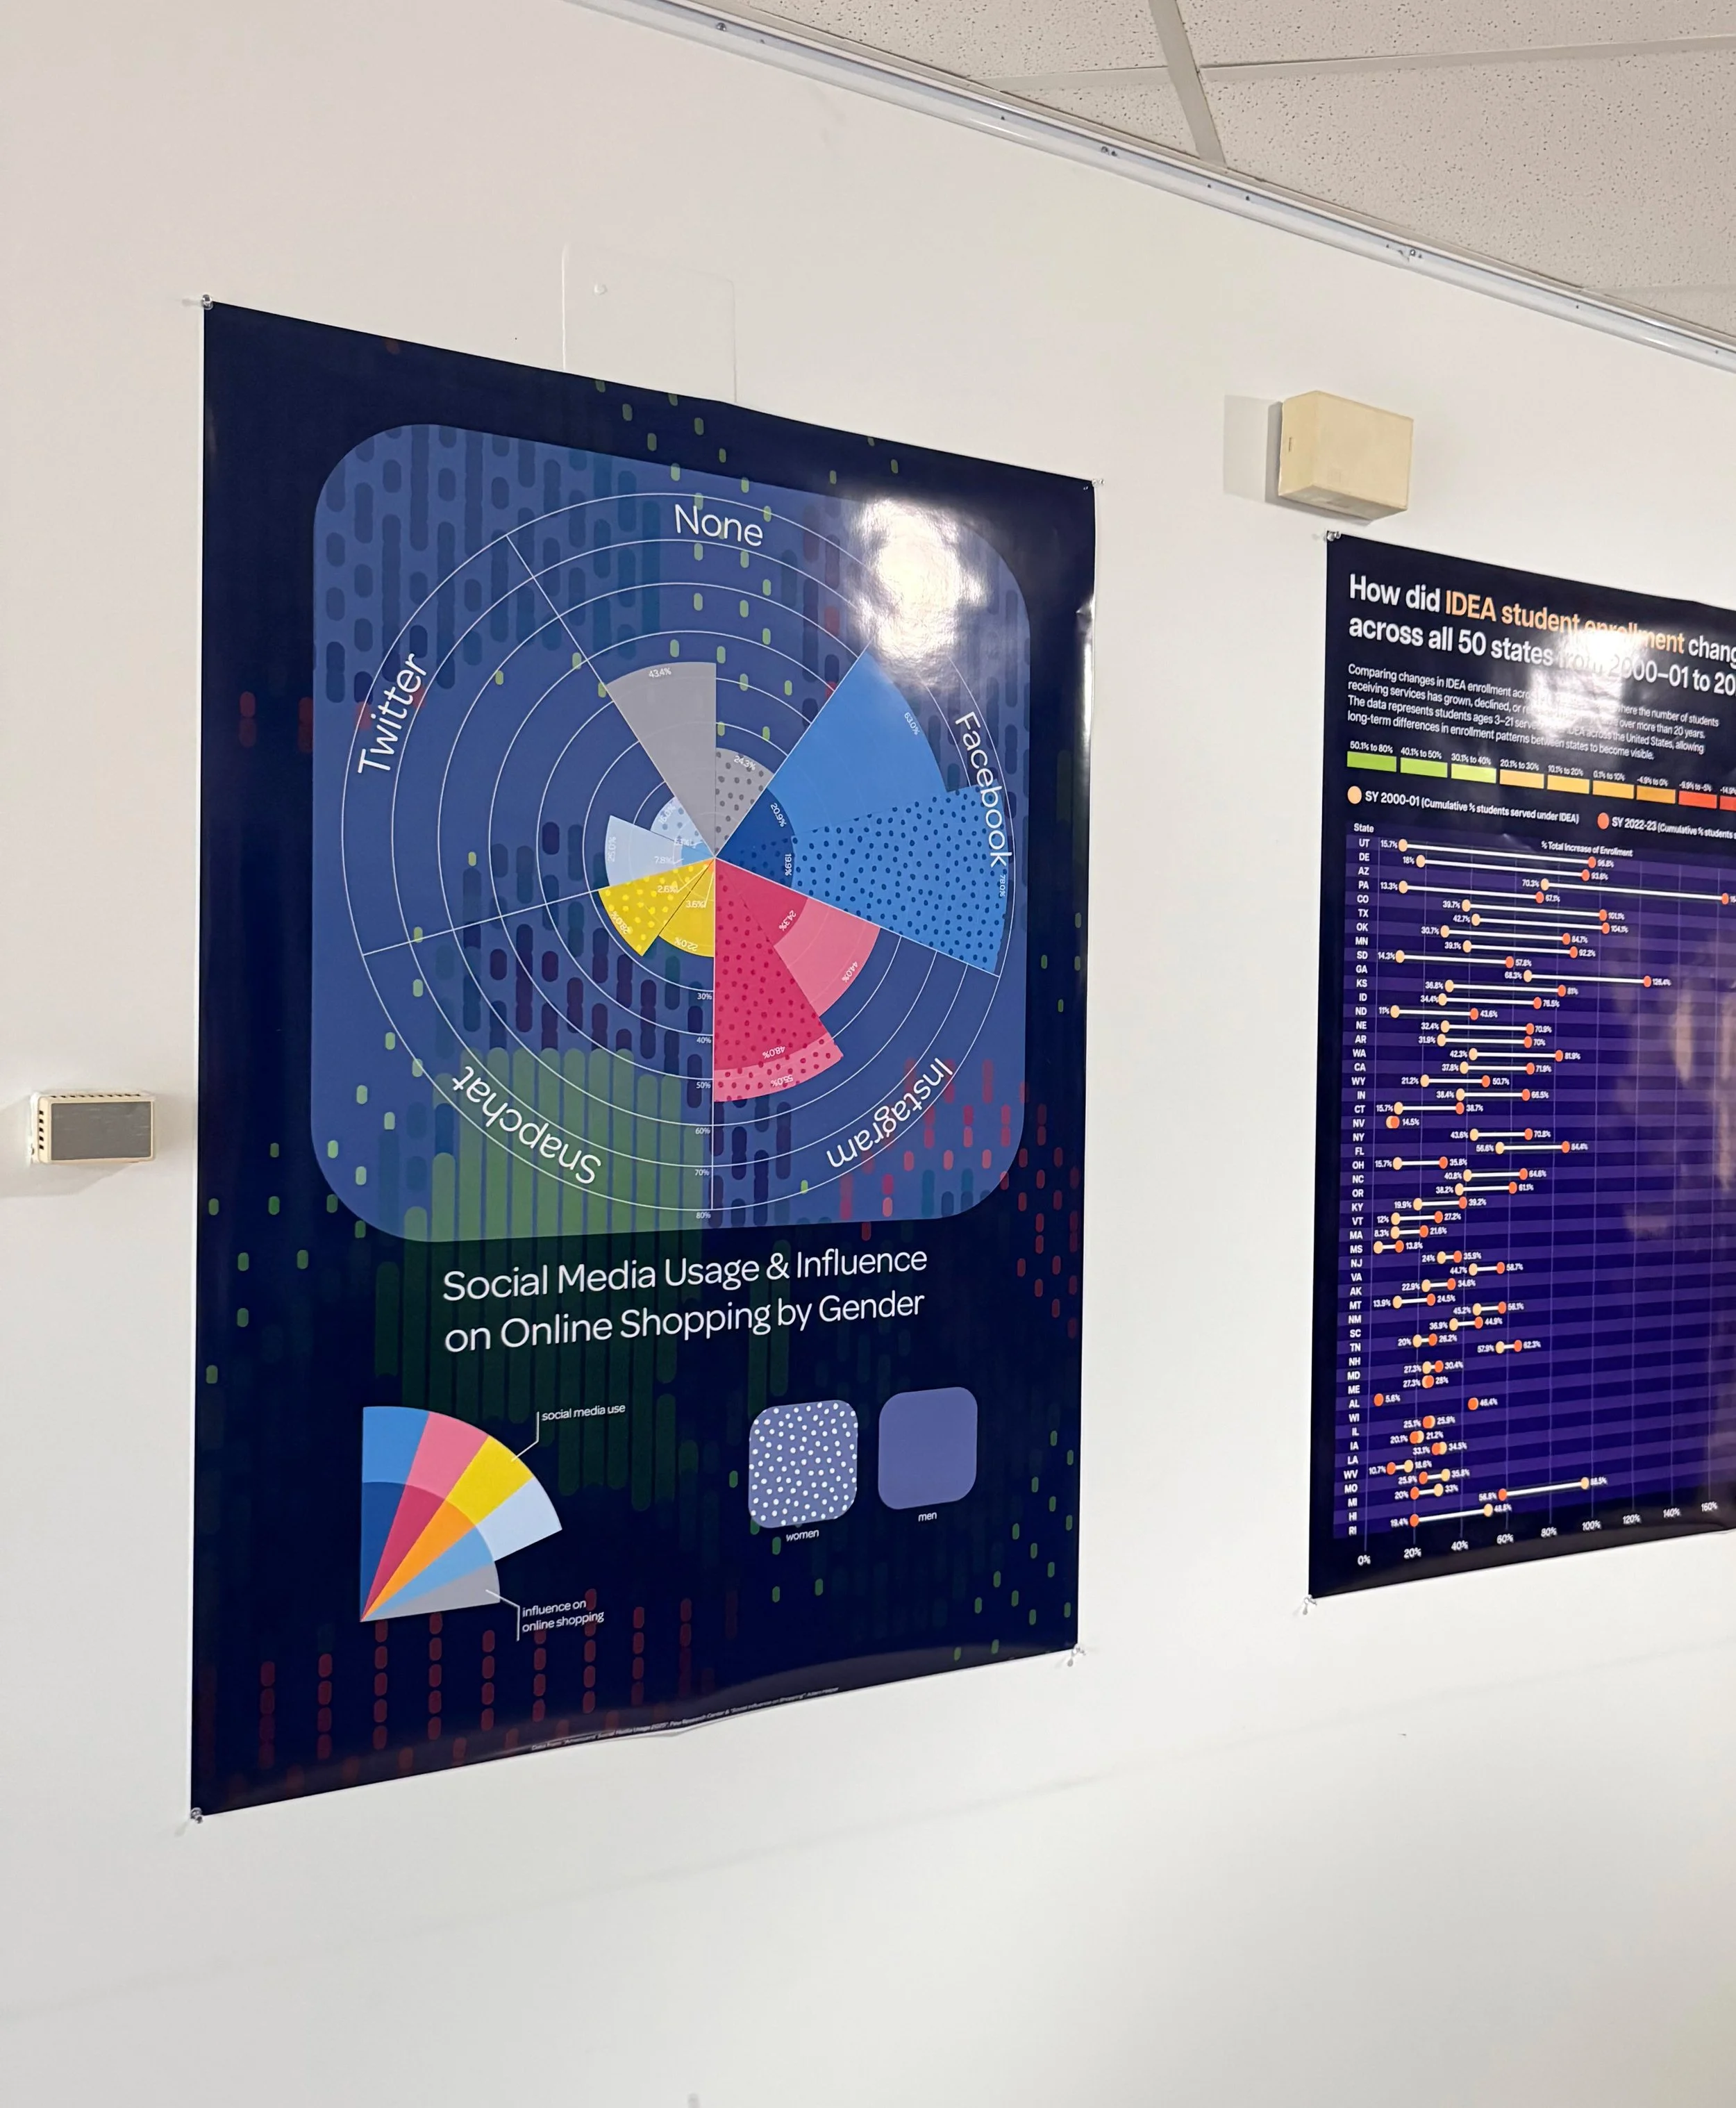
By overlaying two polar area graphs, I created one comprehensive graph that highlighted the gaps between the percent of people using the social media platform, and the percent that report that platform having an influence on their online shopping habits.
Separation by gender allowed me to highlight which platforms each gender uses more and which platforms may tailor more content to certain gender groups over others.
The most prominent conclusion, is while Facebook is the most used platform, Instagram is more influential in increasing online shopping purchases, particularly for women.